Audi - Mobility Platform & System Design
Design Research | Service Design | Experience Strategy
Service Design
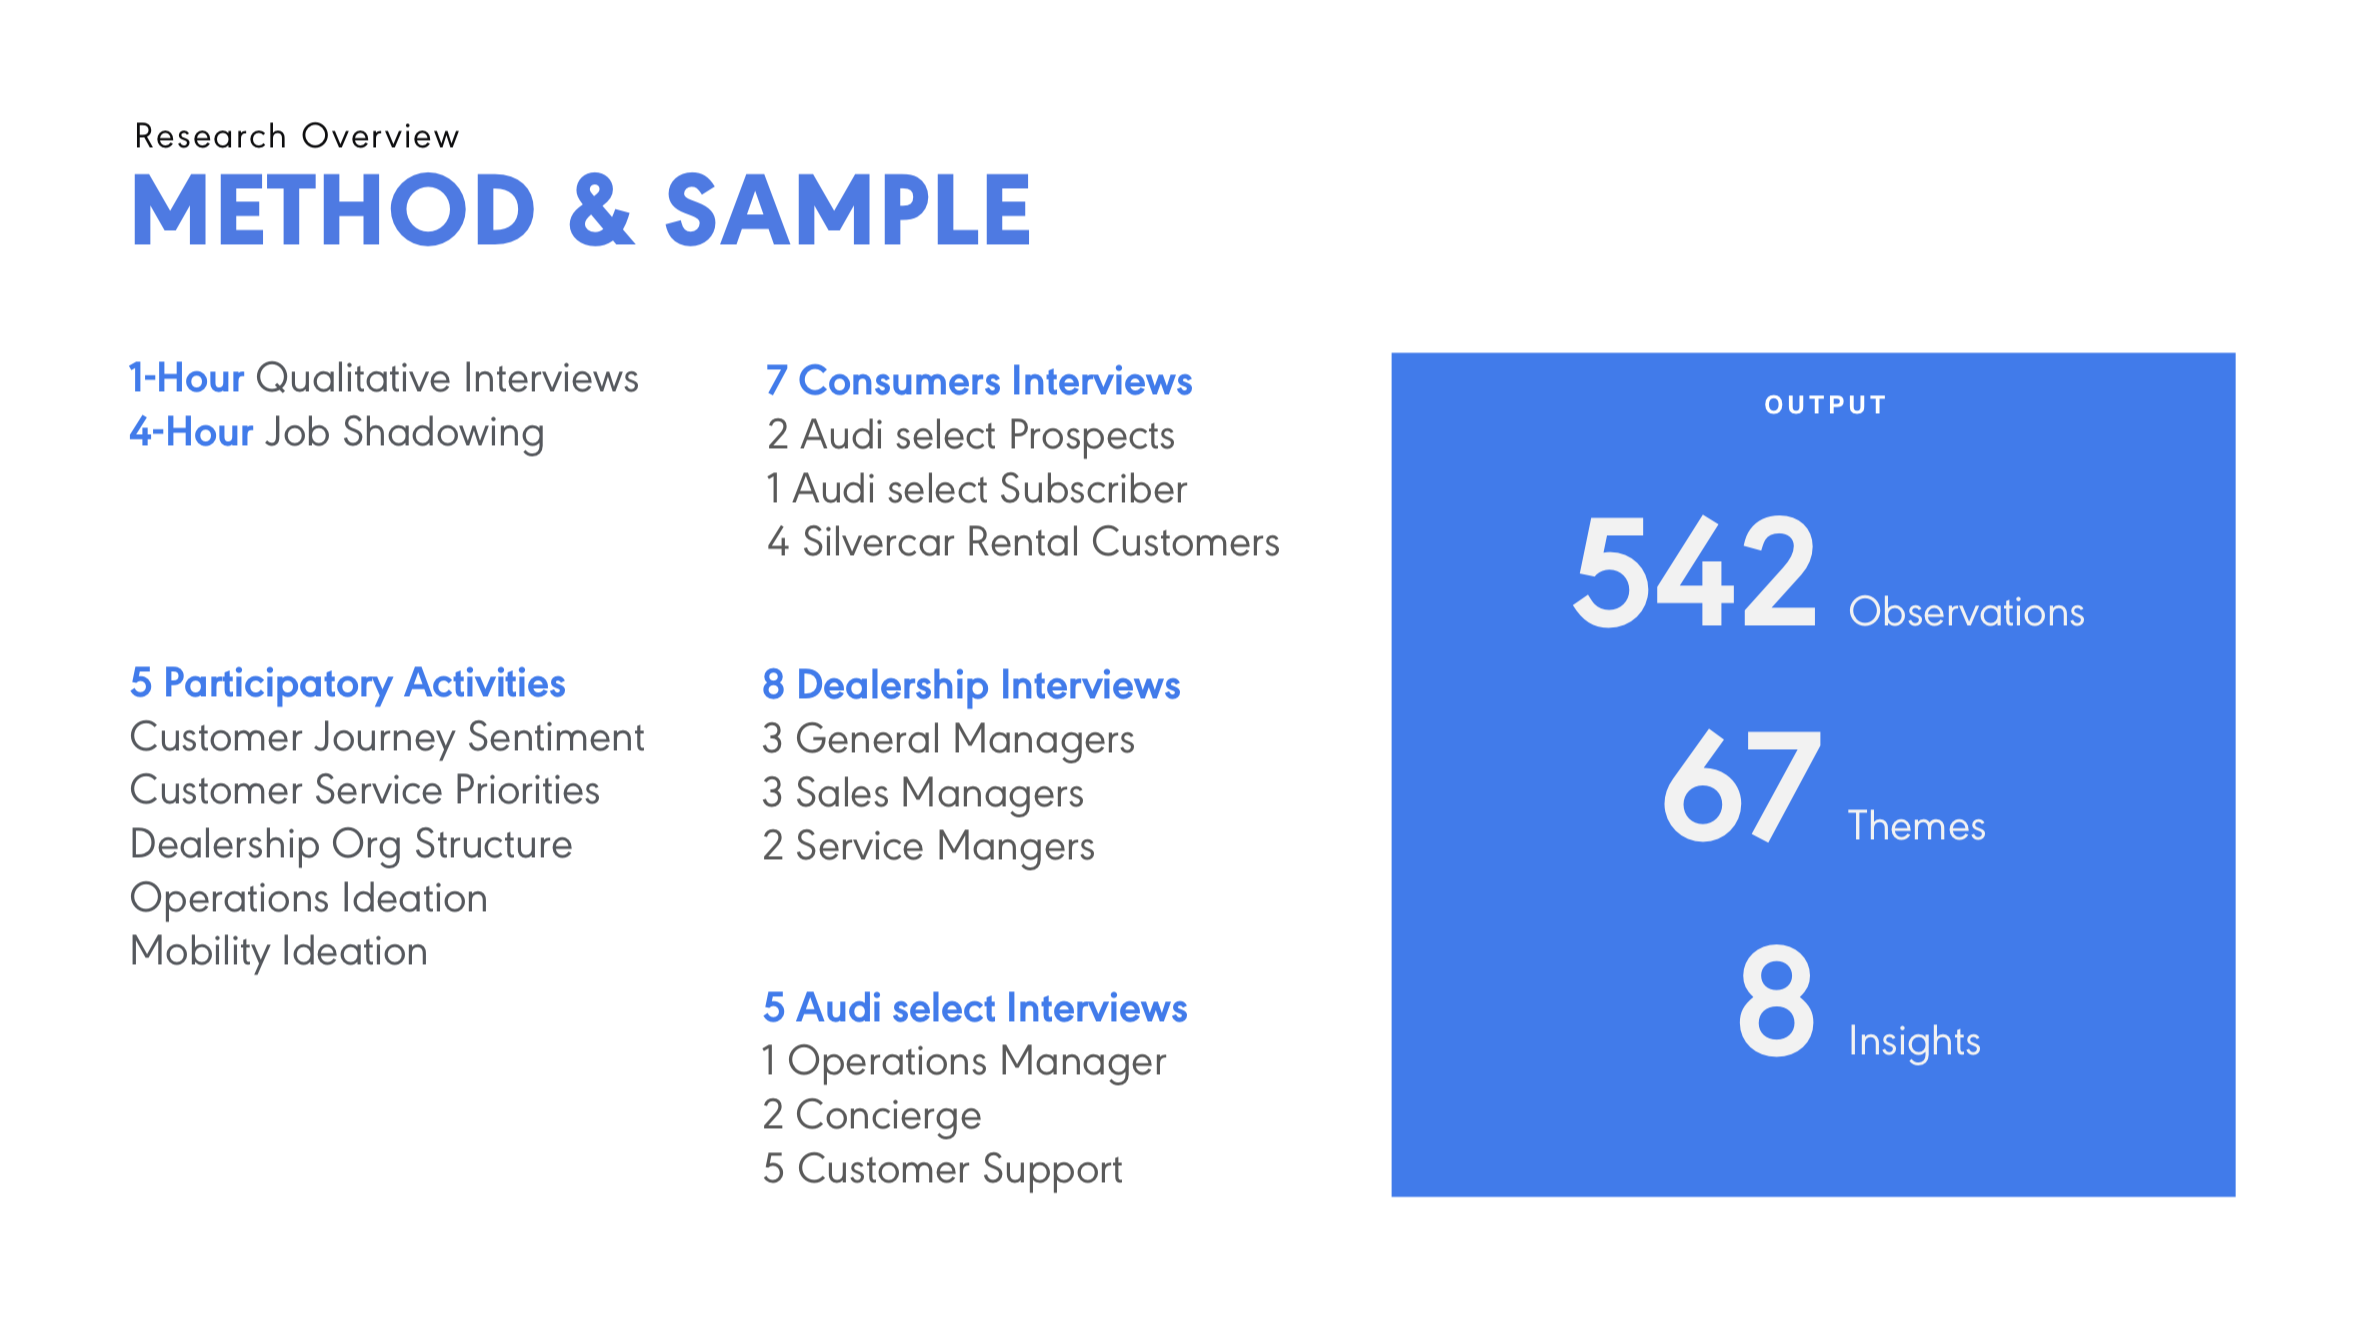
A generative research study was conducted to determine how retailers manage teams, workflows, and assets across multiple services.
Scaling a Platform
Our team helped reduced new customer time-to-value from 2 weeks to 2 days, going from 20 implementations per month to 60 per month.
From $10m to $45m ARR
The Dealerware portion of the business saw year-over-year growth from 80 locations, to 300, to 700 locations.
Situation
- Consumers are interested in aquuiring vehicles that do not require ownership.
- Vehicles on dealership lots are not generating optimal revenue.
Tasks
- Find a way to offer new mobility services to increase revenue per vehicle.
Conduct a study on current dealership operations around fleet management.
Produce a model for utilizing
depreciated vehicles.
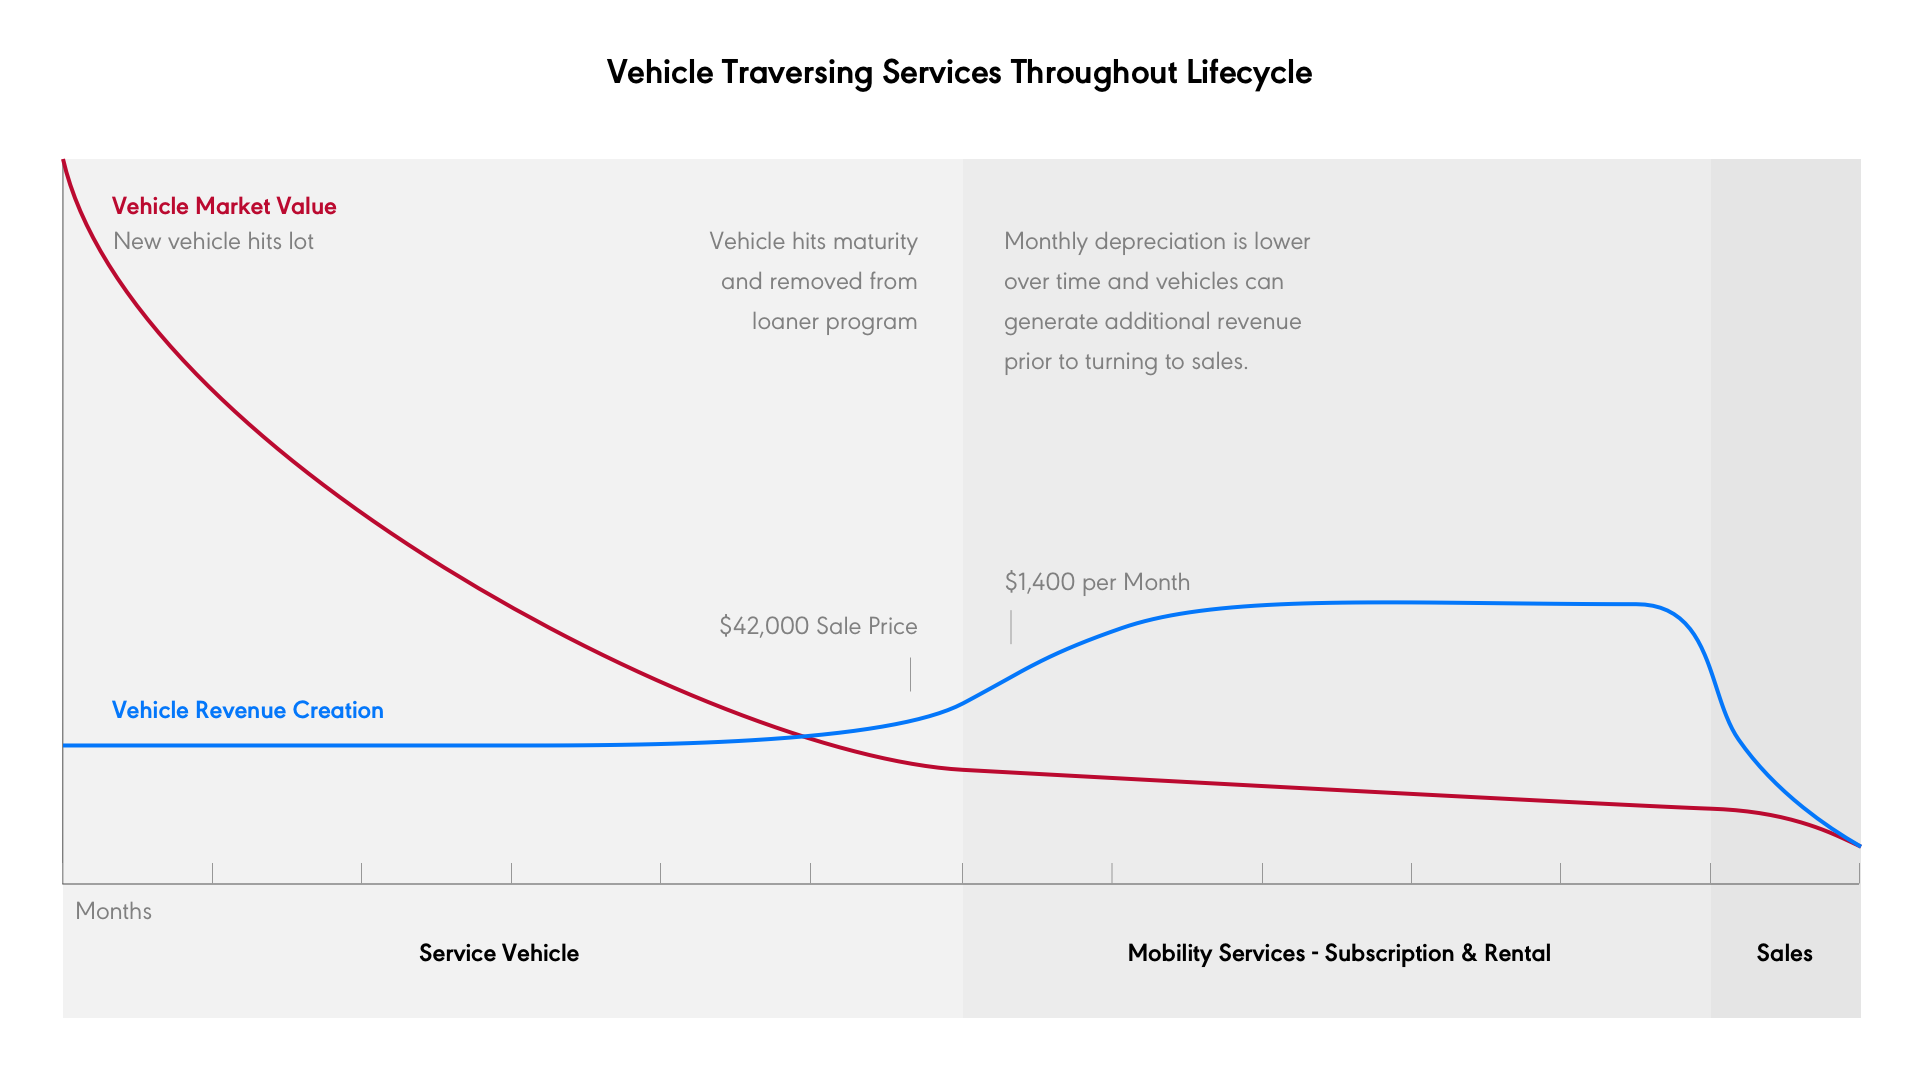
The first-year vehicle depreciation was a hinderance for the sale team, though an opportunity for rental and subscription services. As vehicles hit their maturity point, they could be moved in to other services, rather than auctioned off for a loss.
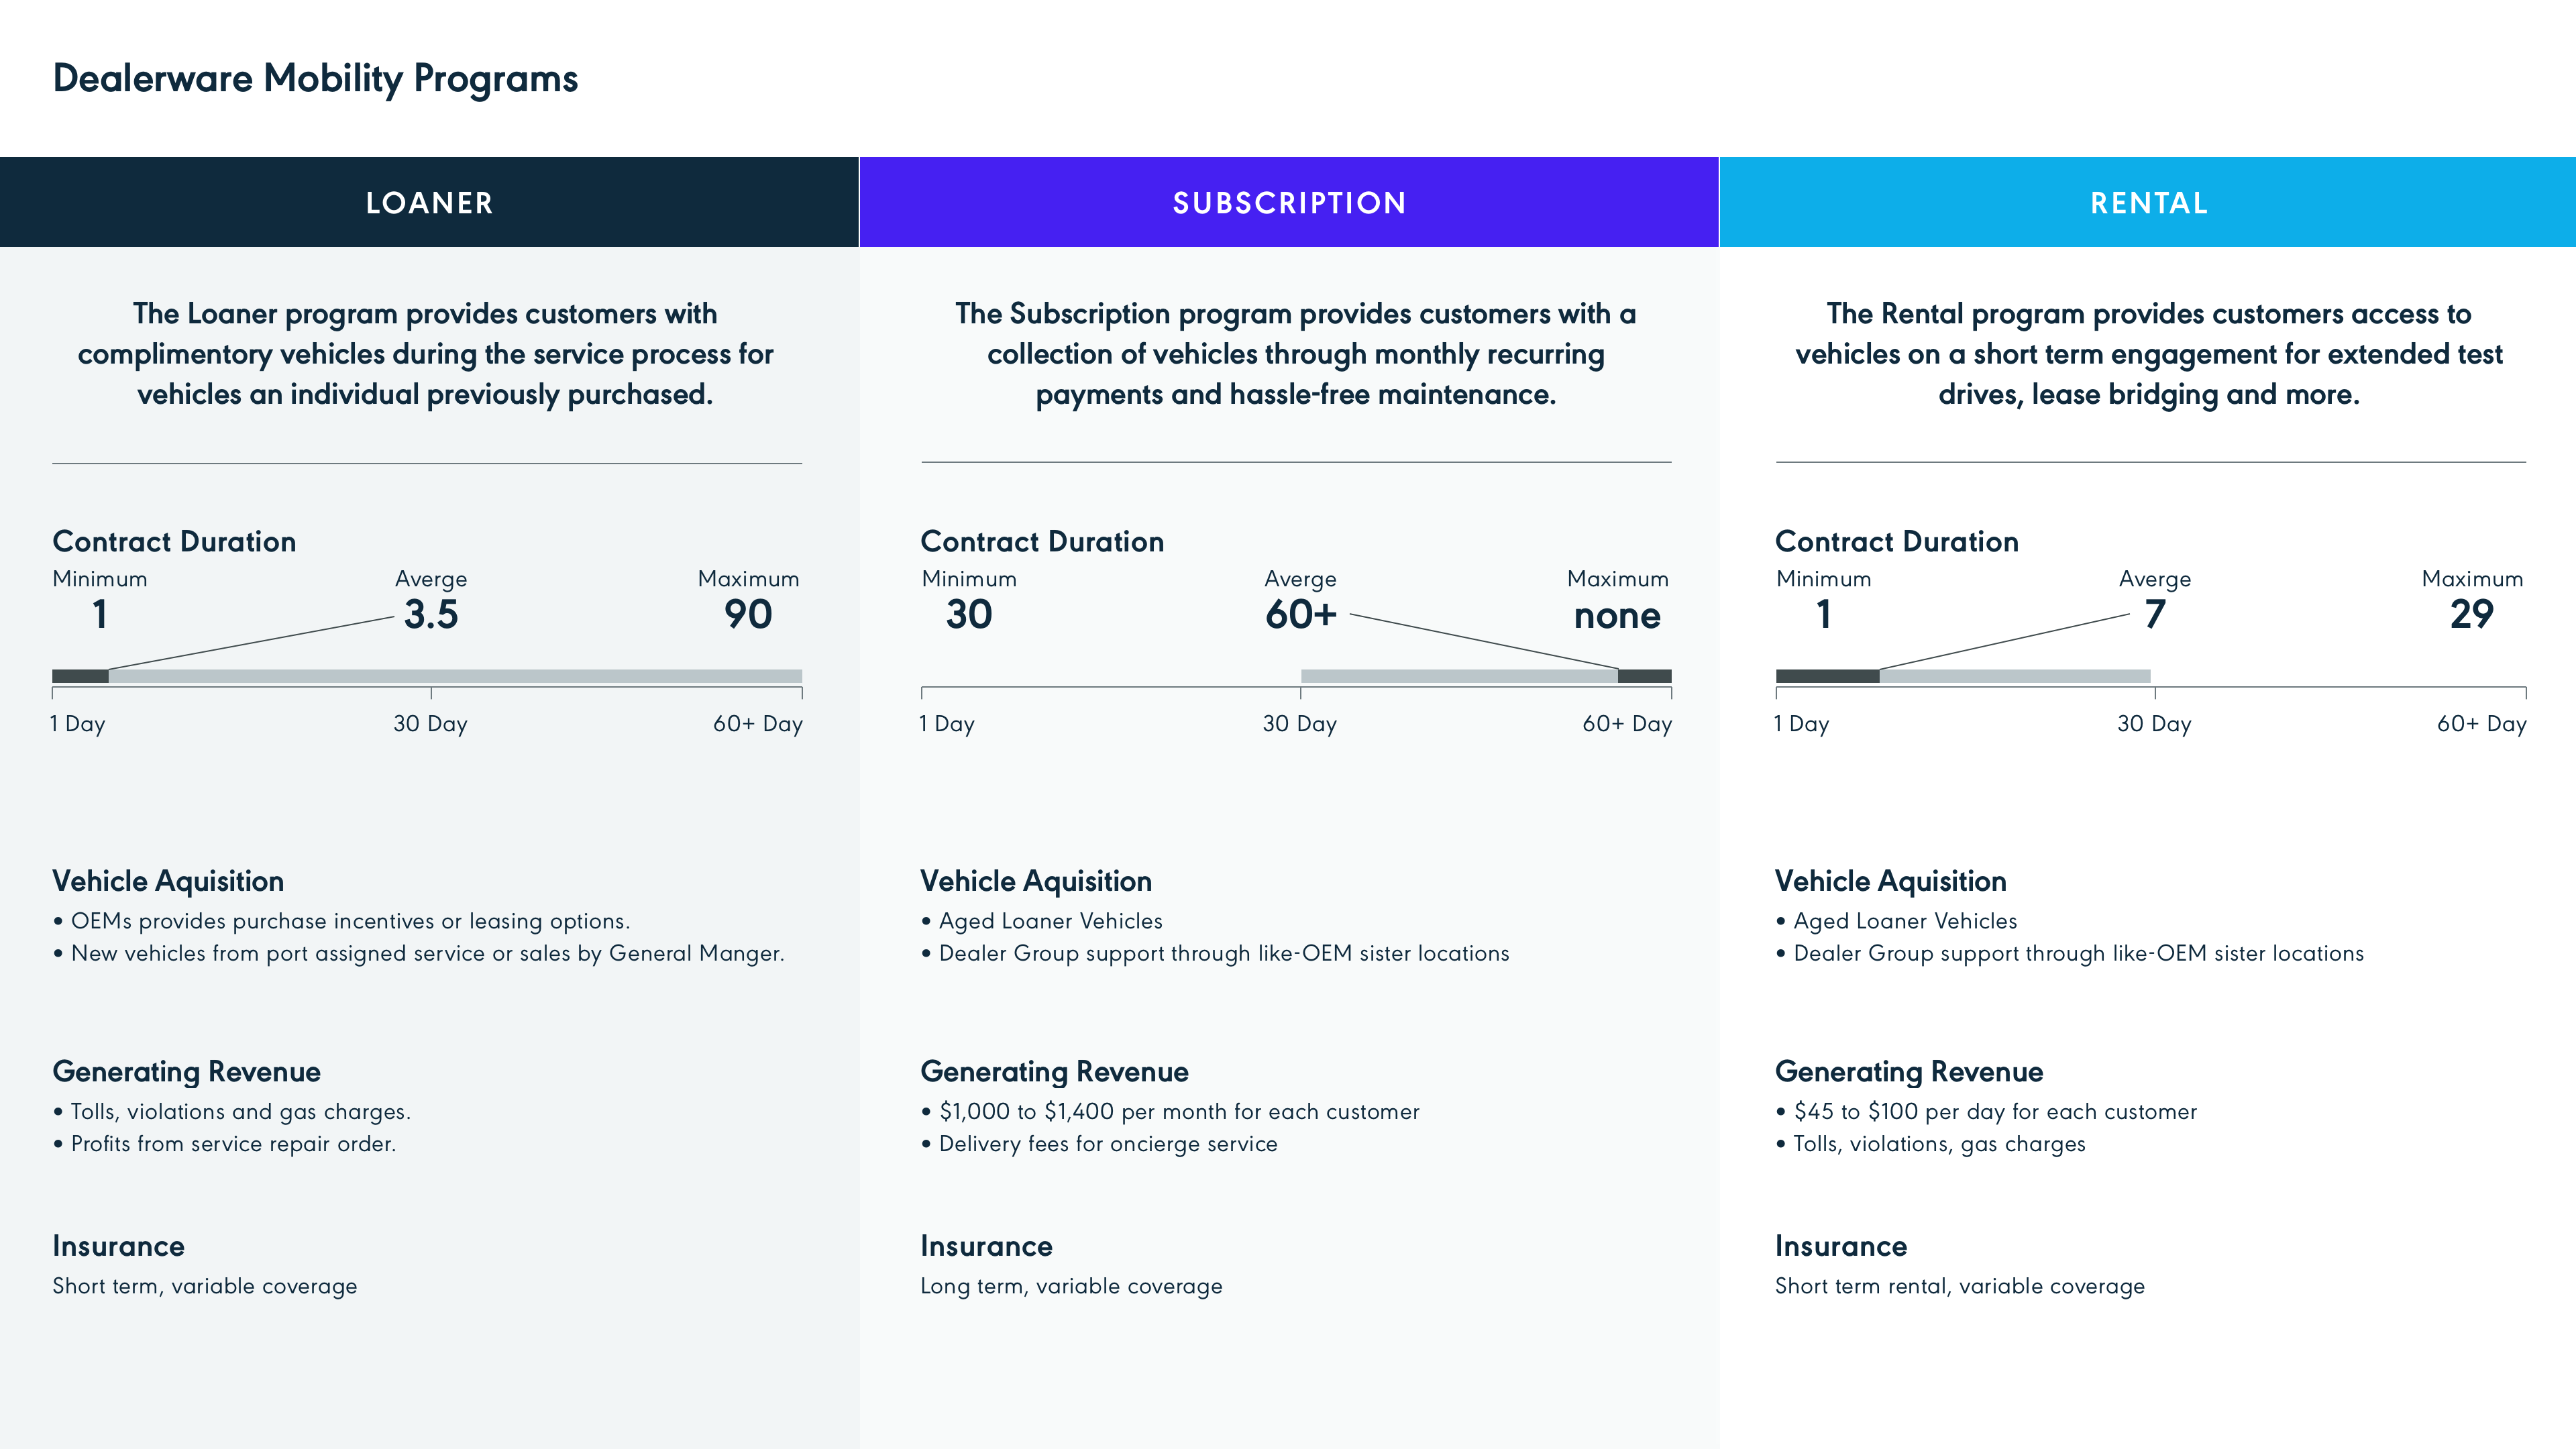
Centralize fleets and people to better manage multiple services.
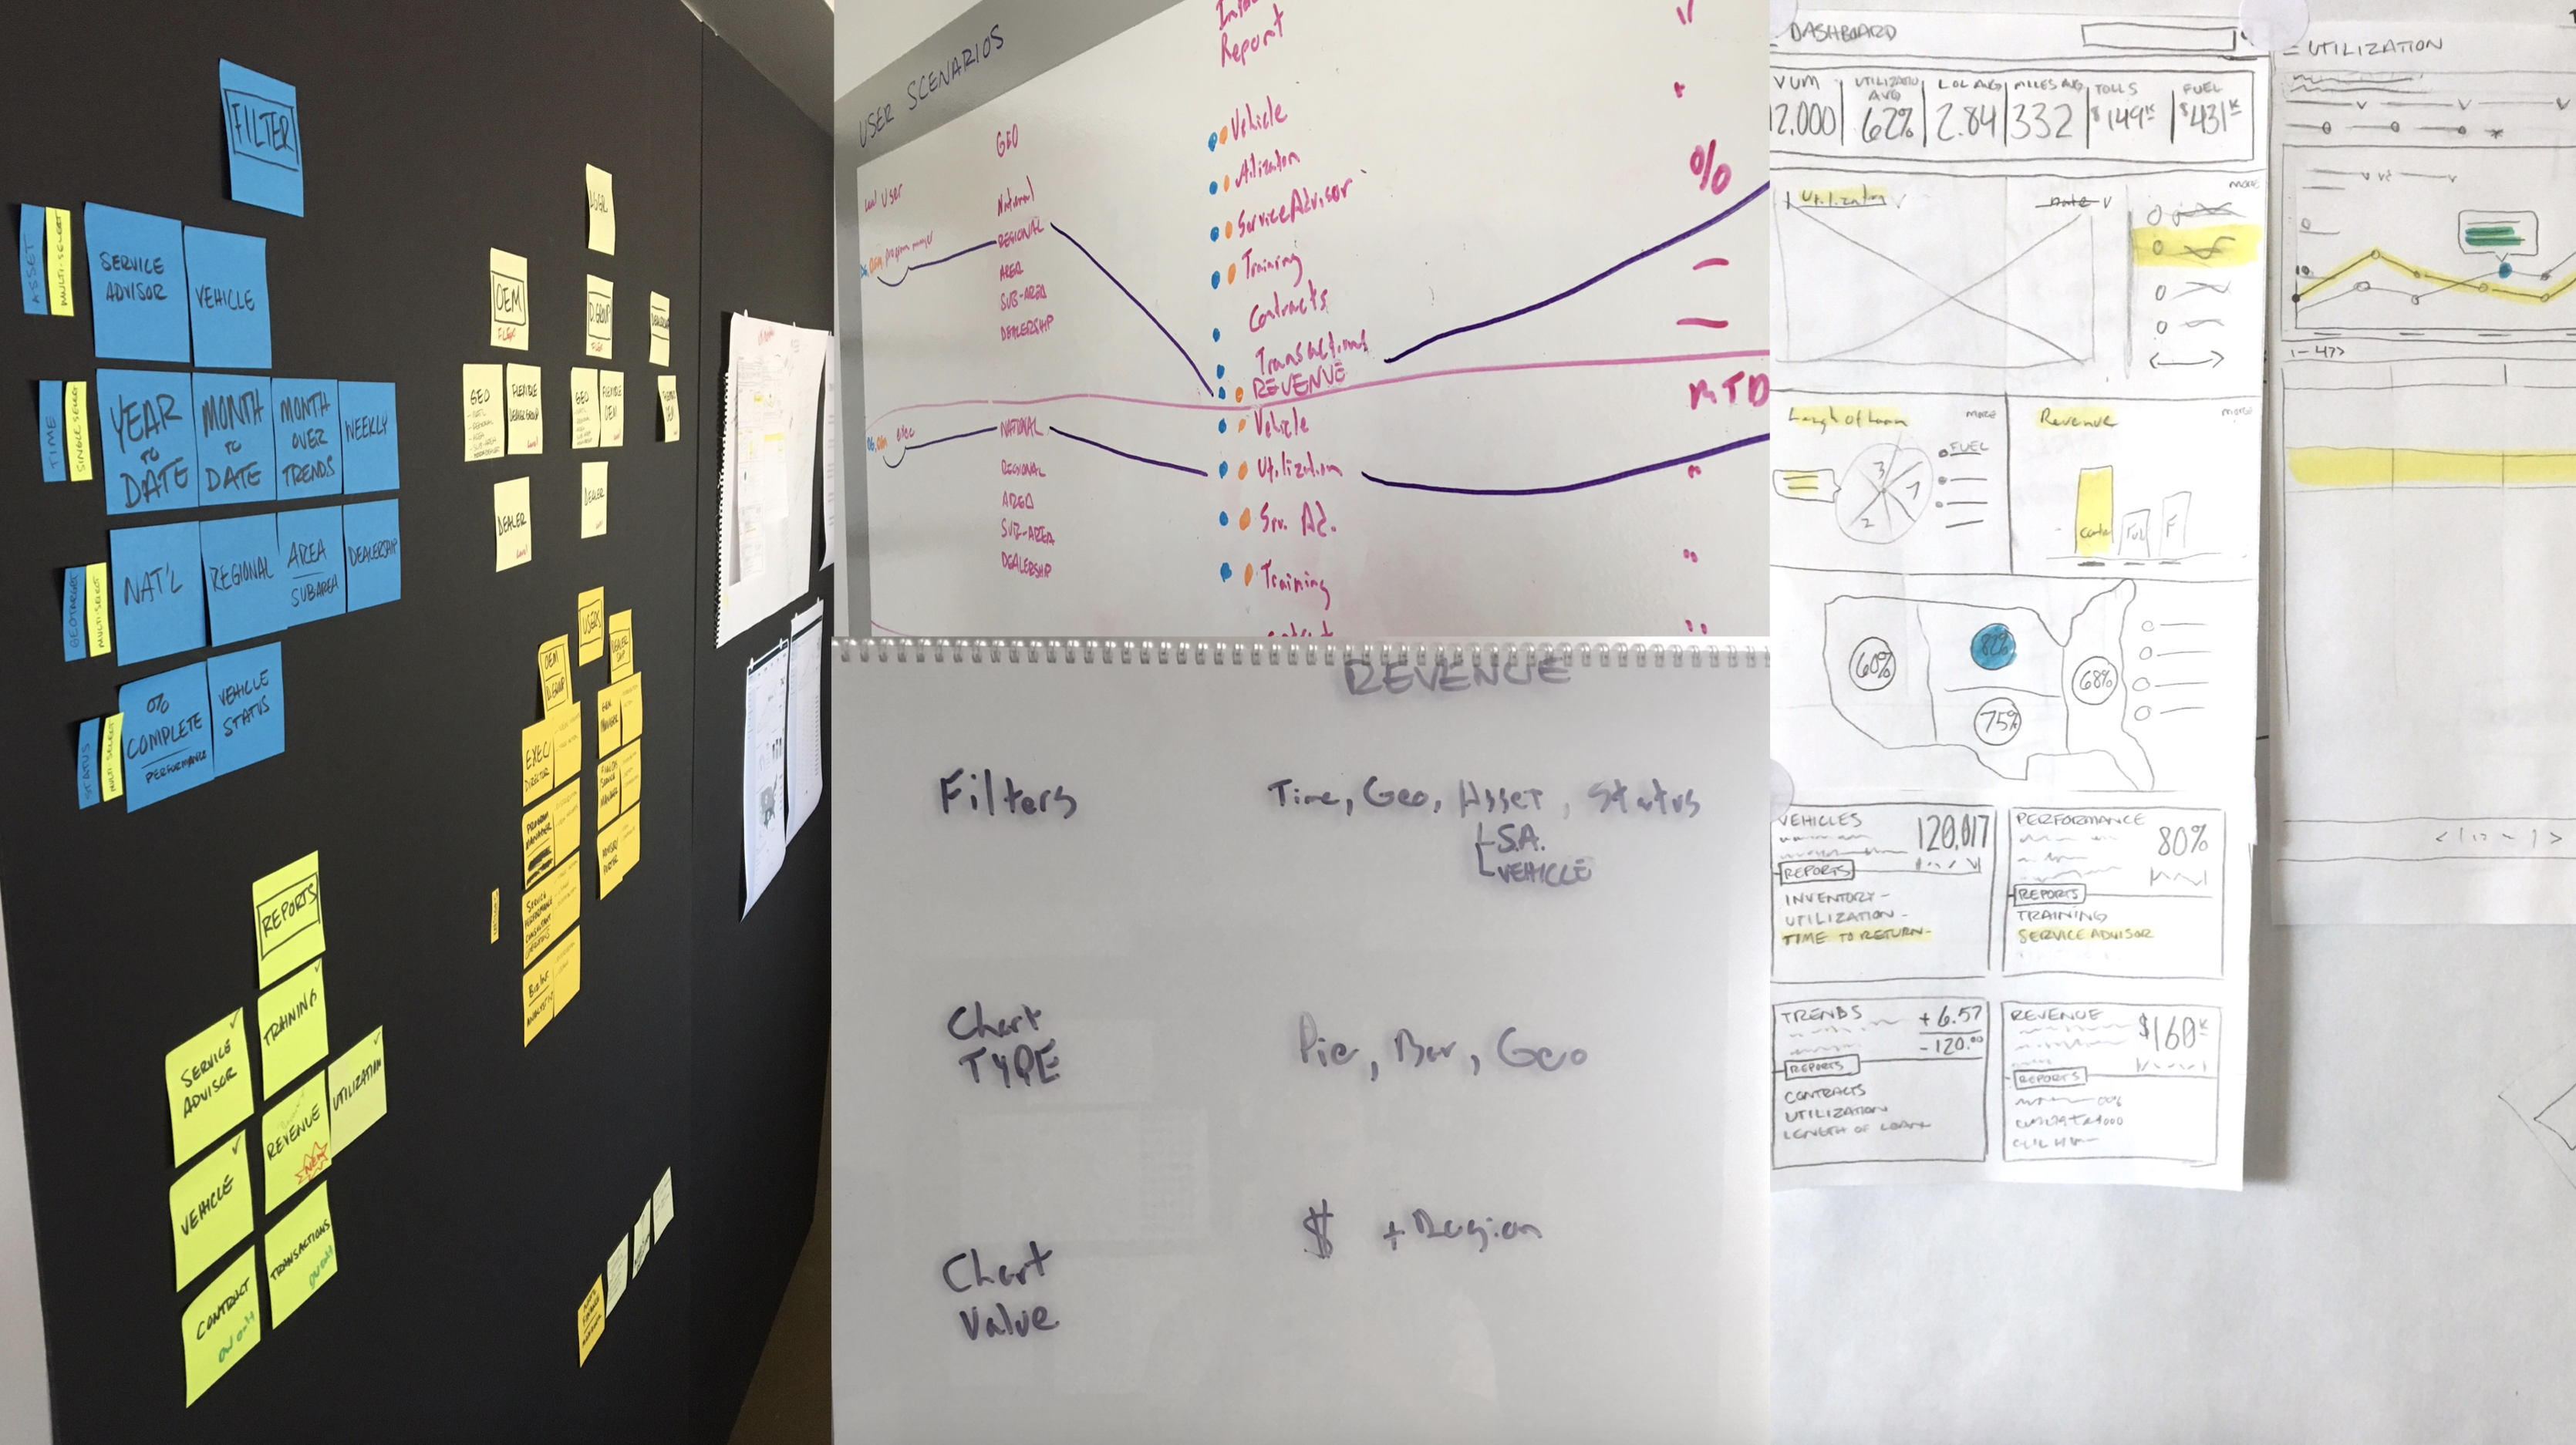
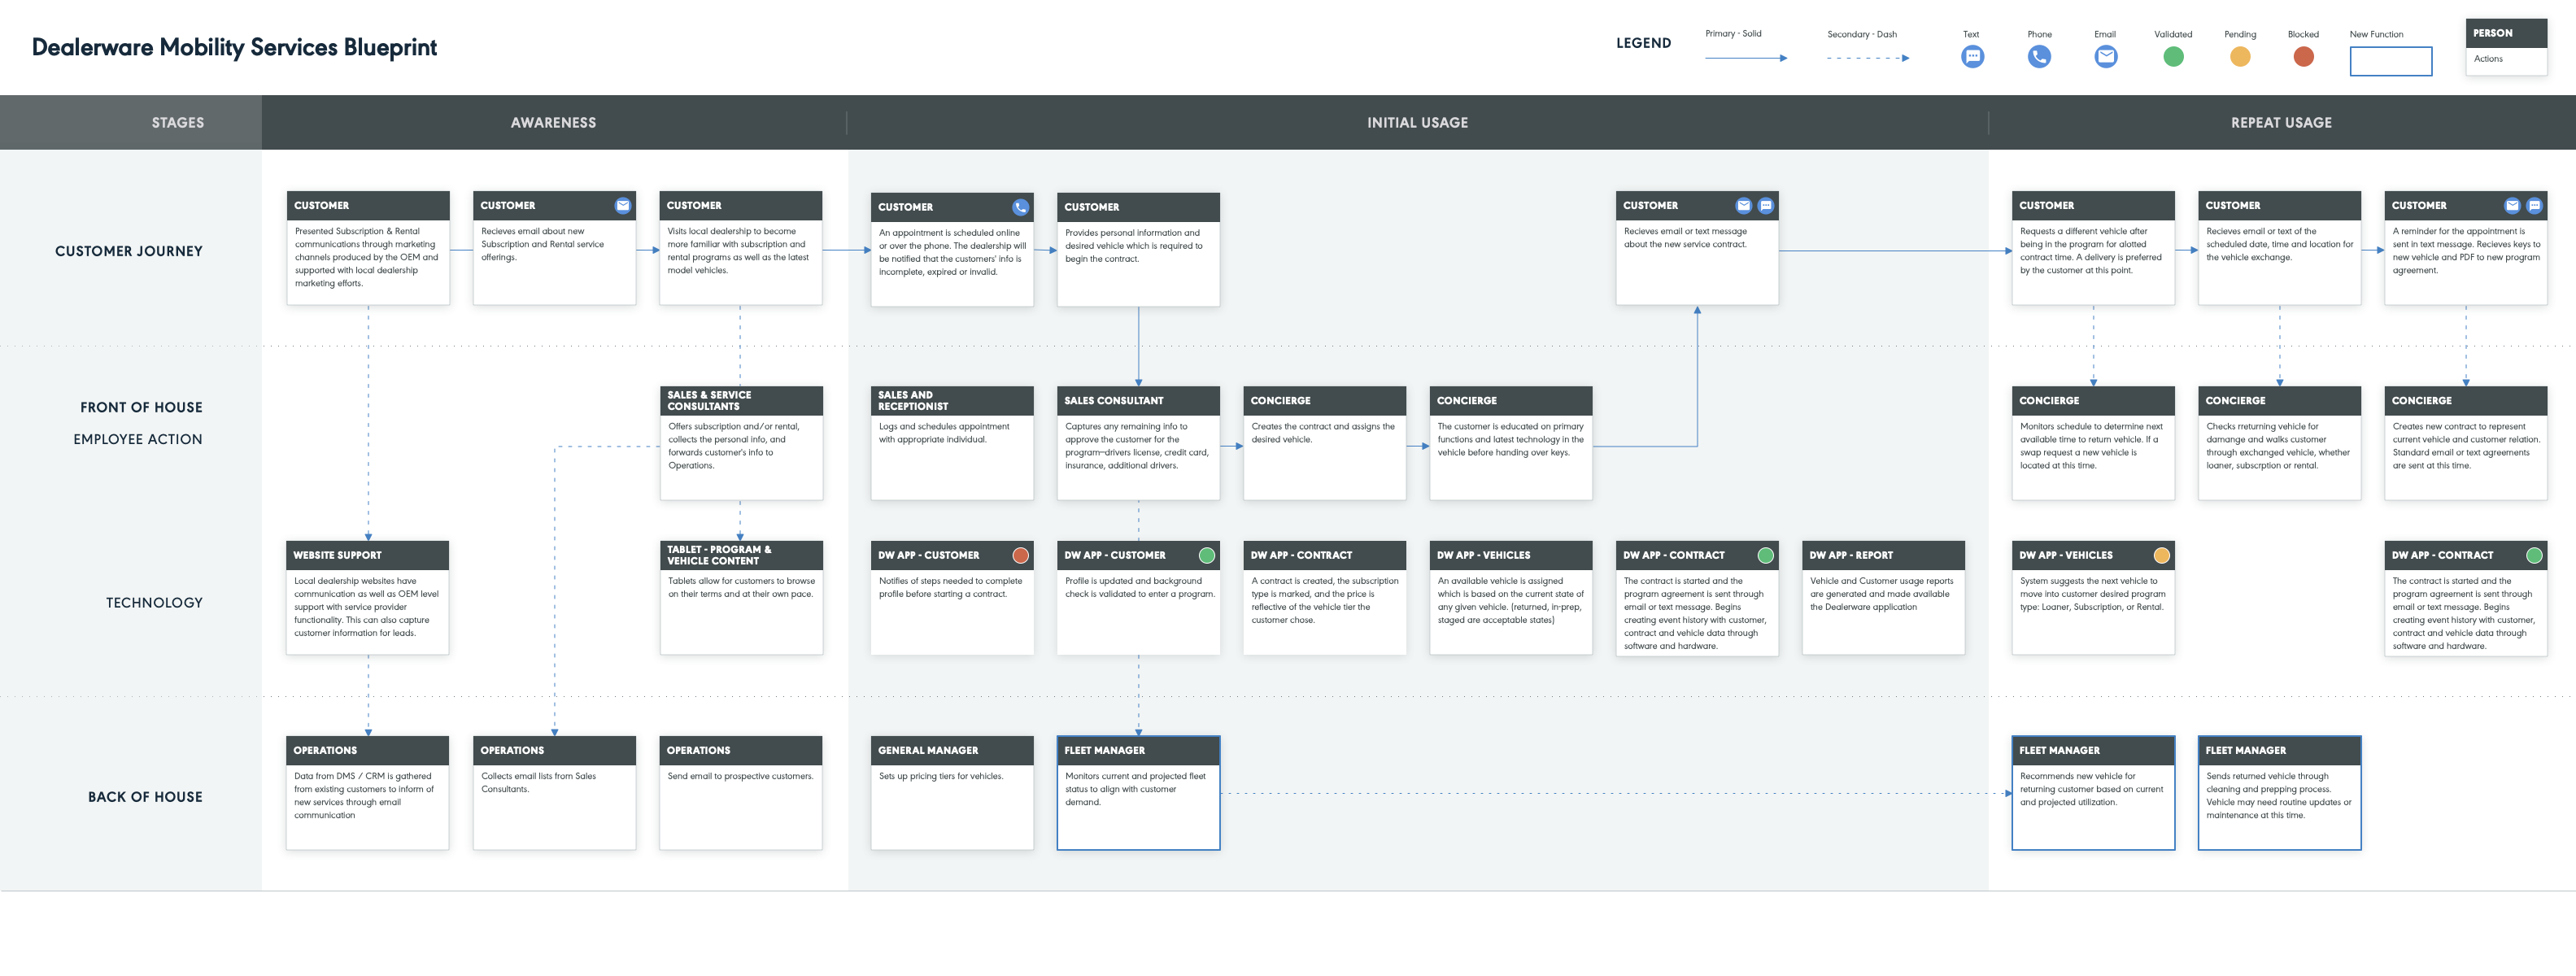
During our research we sat down with fleet managers at all levels to talk about current operations of sales and service. We mapped out their current organization model, then we added a rental & subscription fleet to the model. We asked how they would organize their teams if they were to support these two new offerings.
The finding was that 5 out of 6 companies designed a fleet and team organization that was more centralized manager and fleet. This is is opposition to the sales team having their cars, and the service team having their car, which left a high volume of under-utilized vehicles.
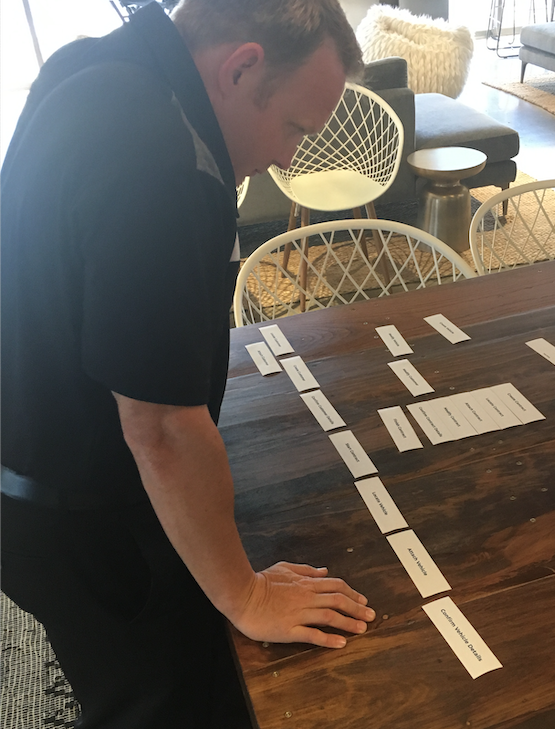
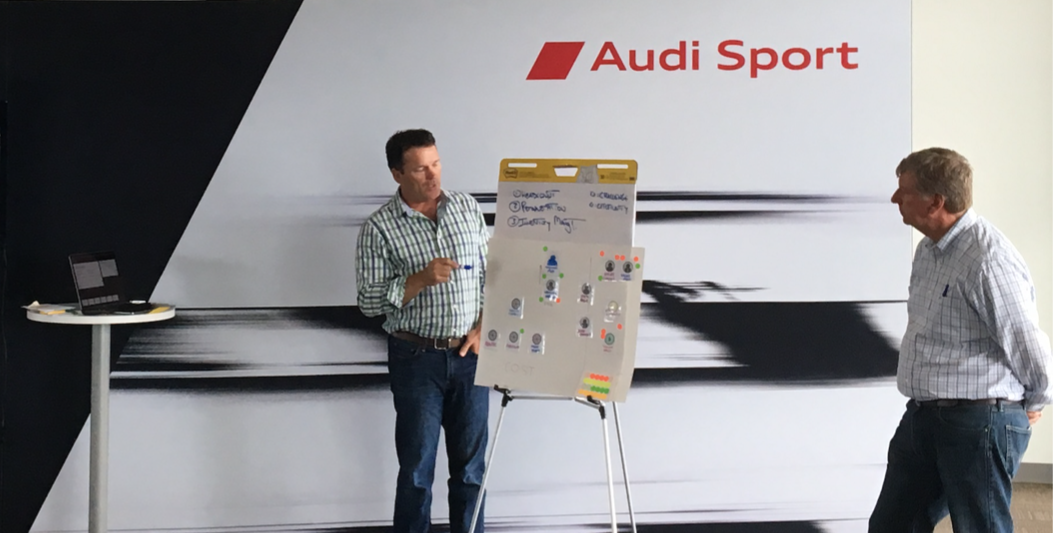
Presenting & Workshoping with a Key Sub-Council

Service Design Bringing All 3 Services Together
Leadership
There was an everpresent complexity through these phases. I was able to coach the team with processes for discovery research and activities for participatory design. The resulting artifacts were key to aligning teams and stakeholders.
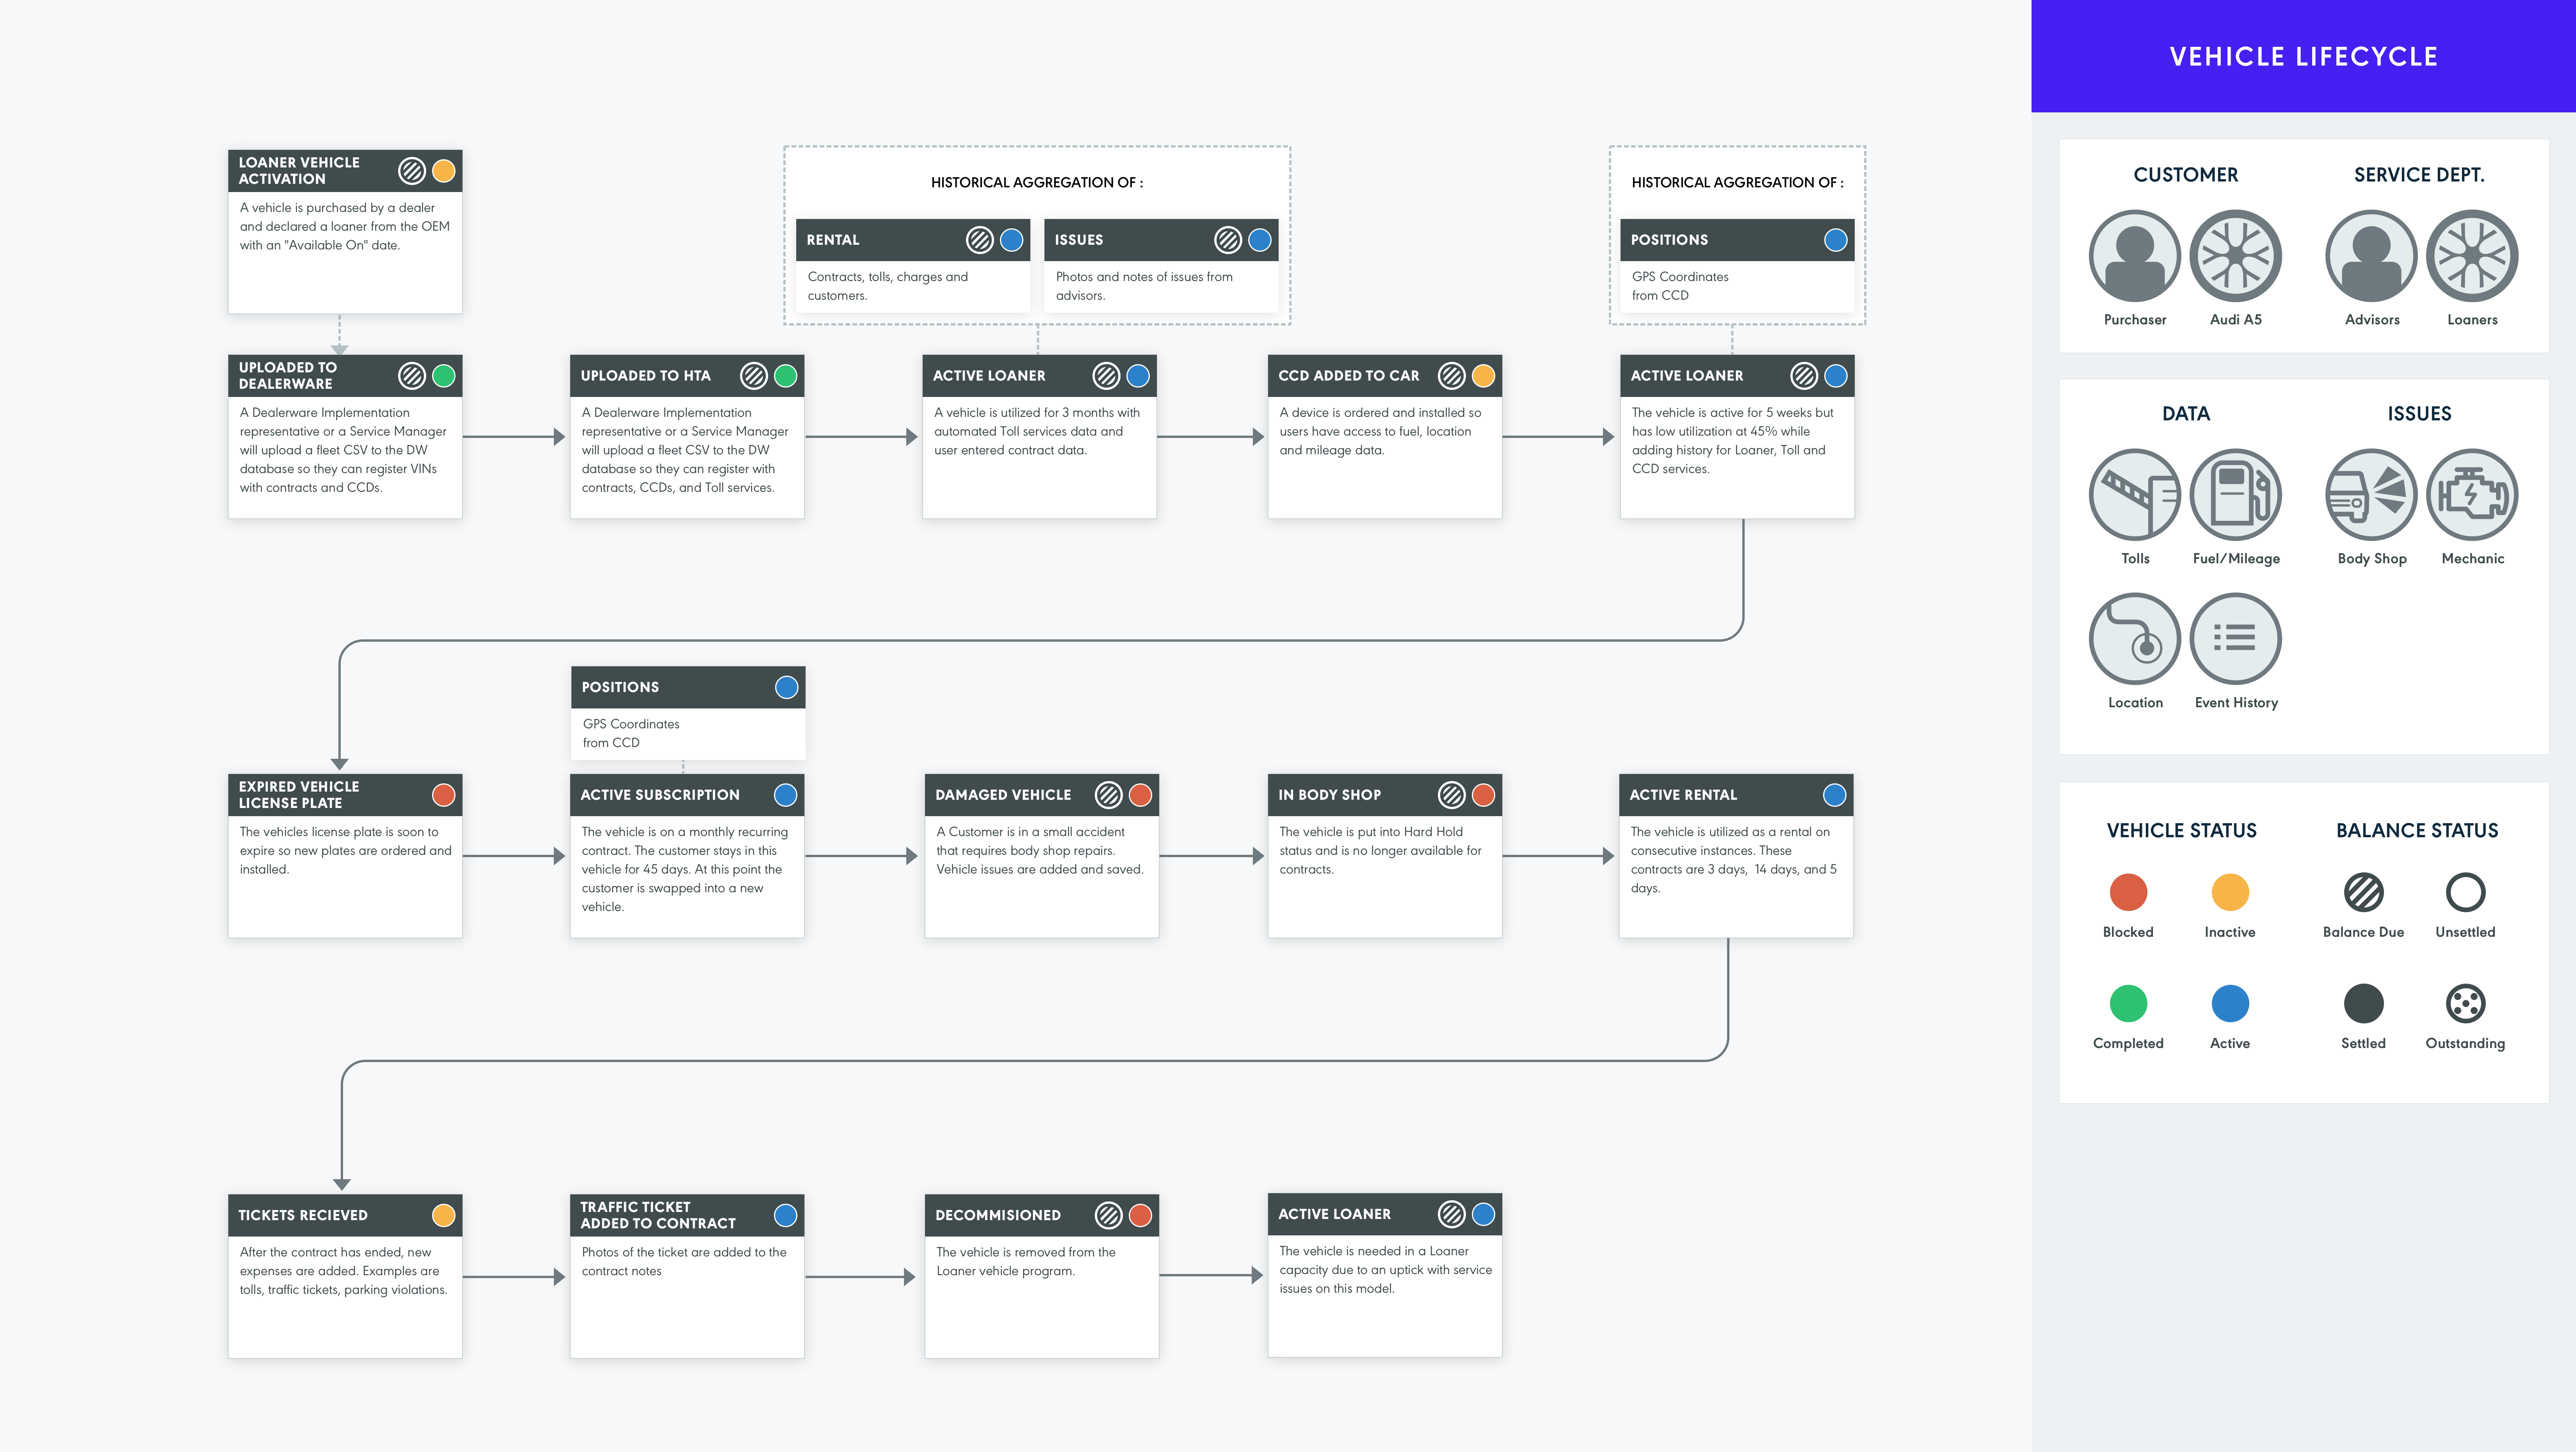
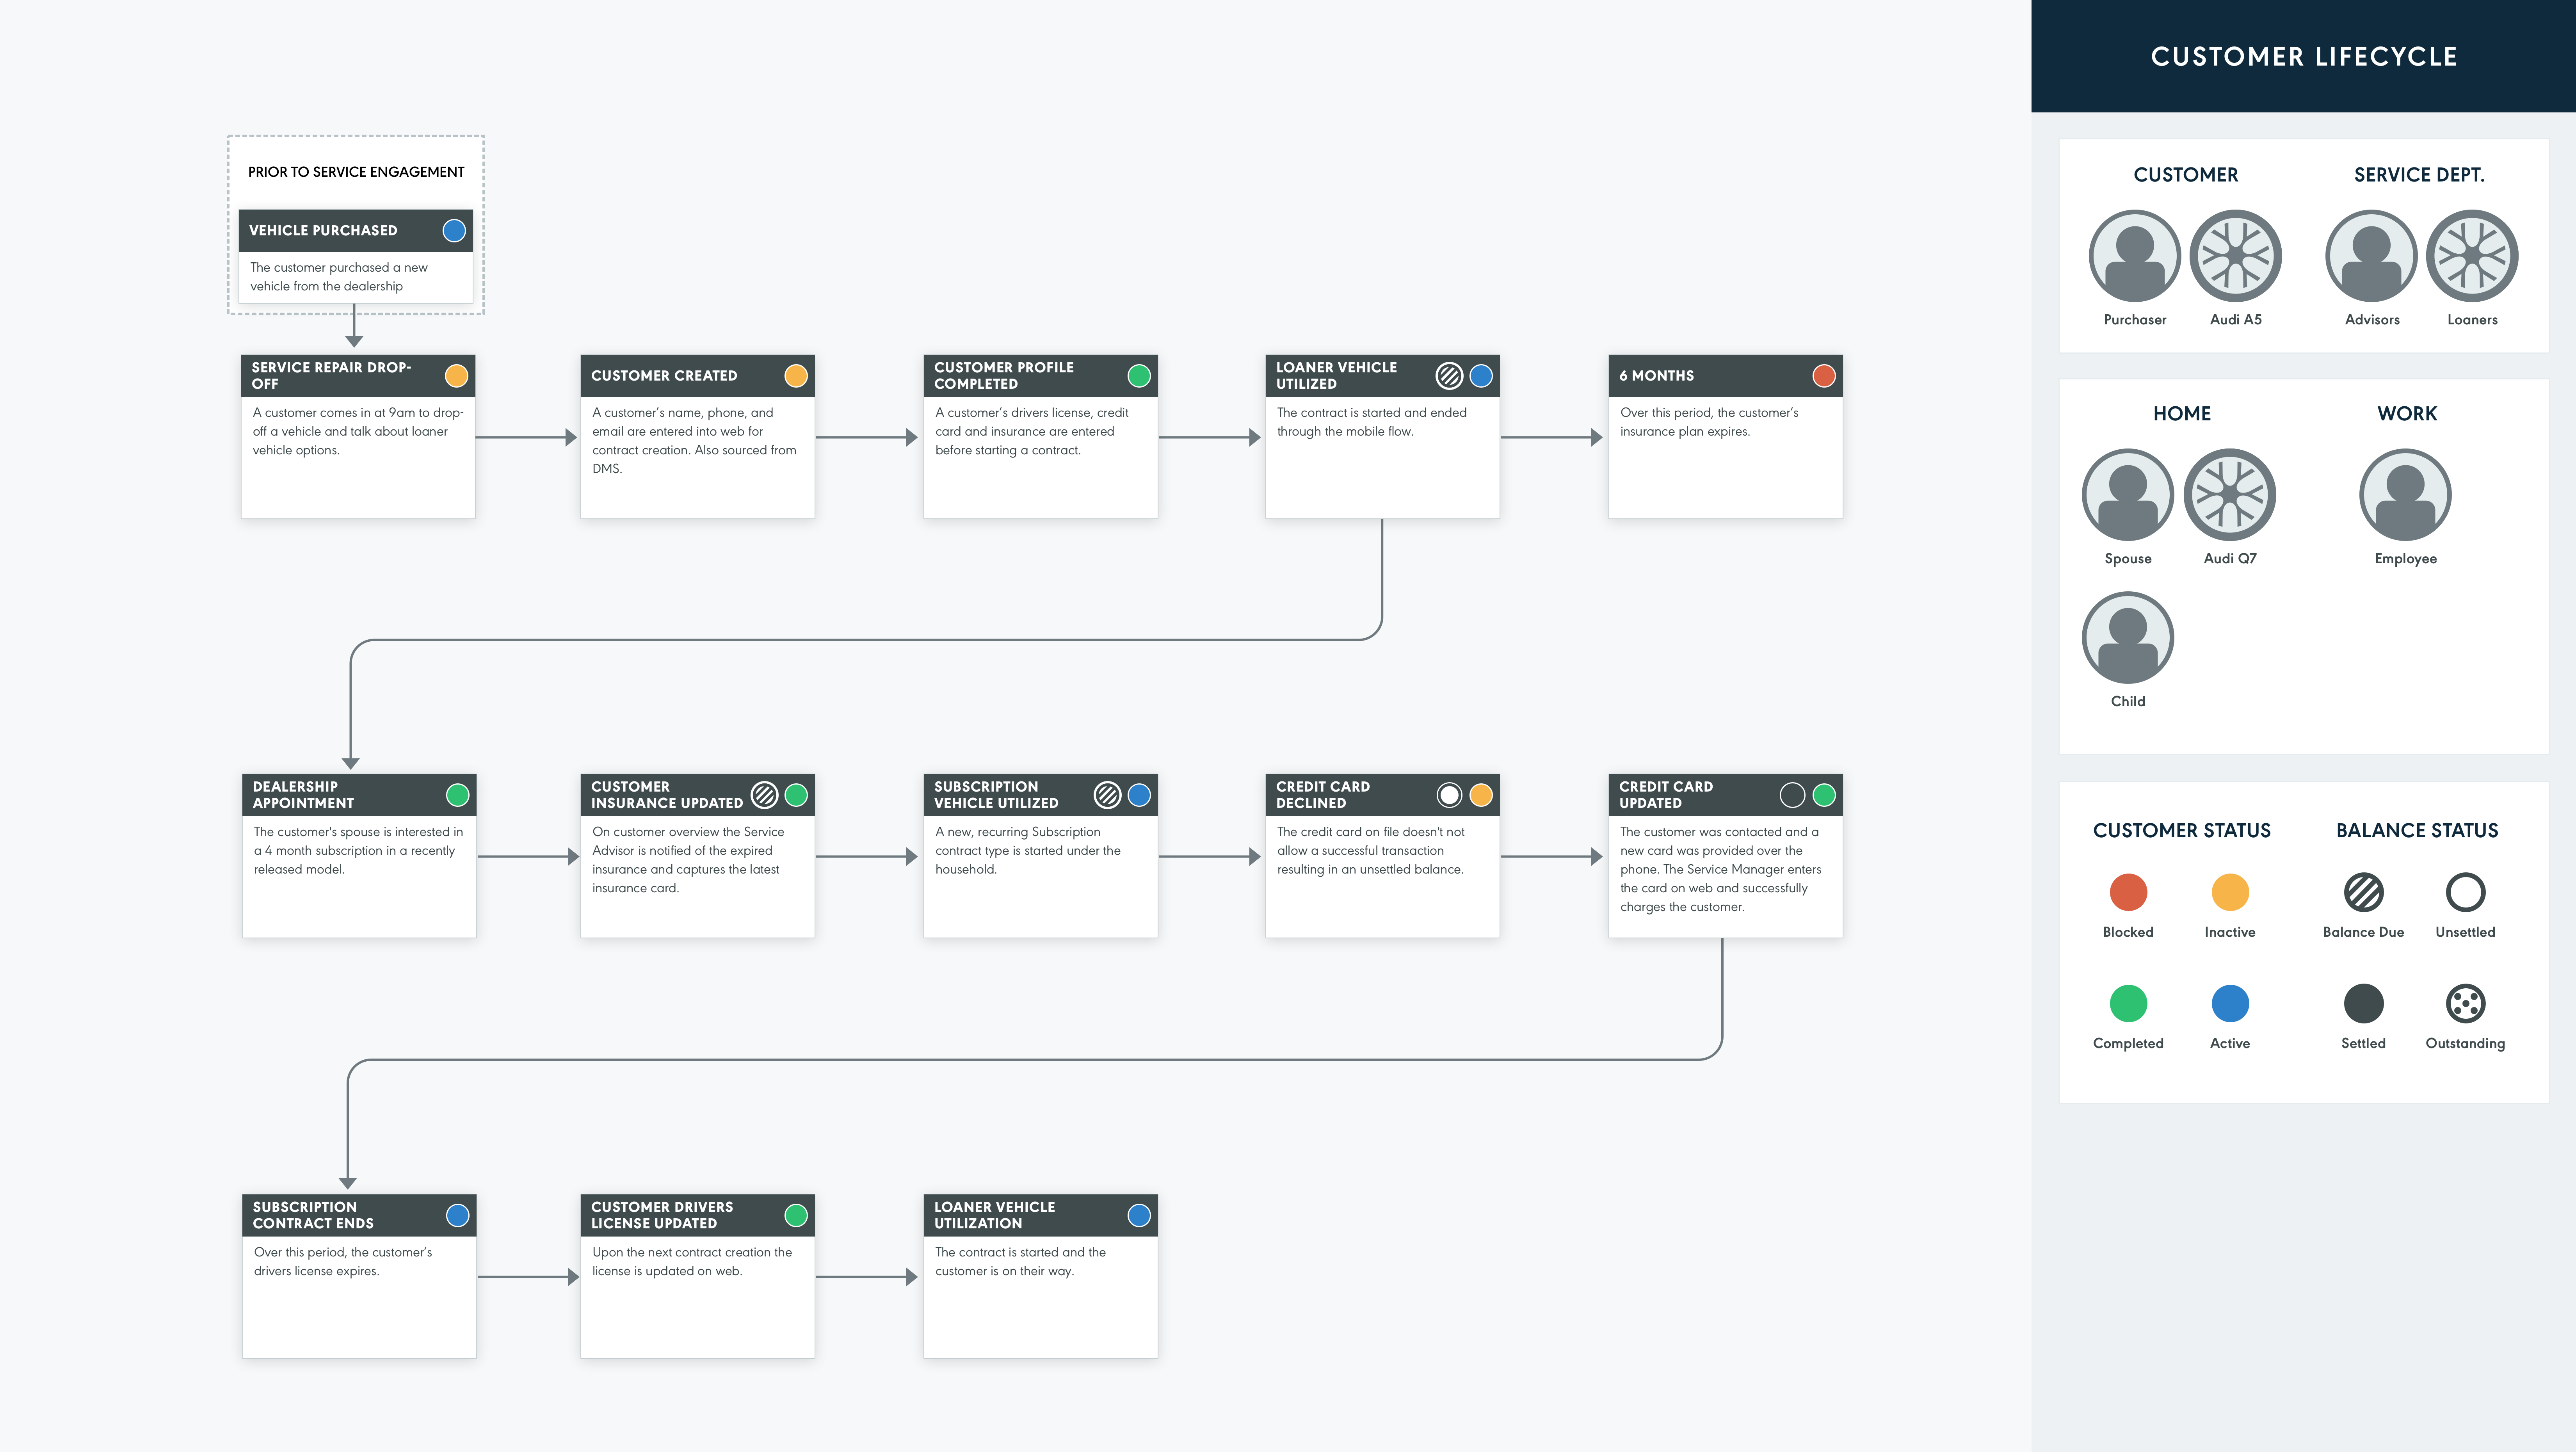
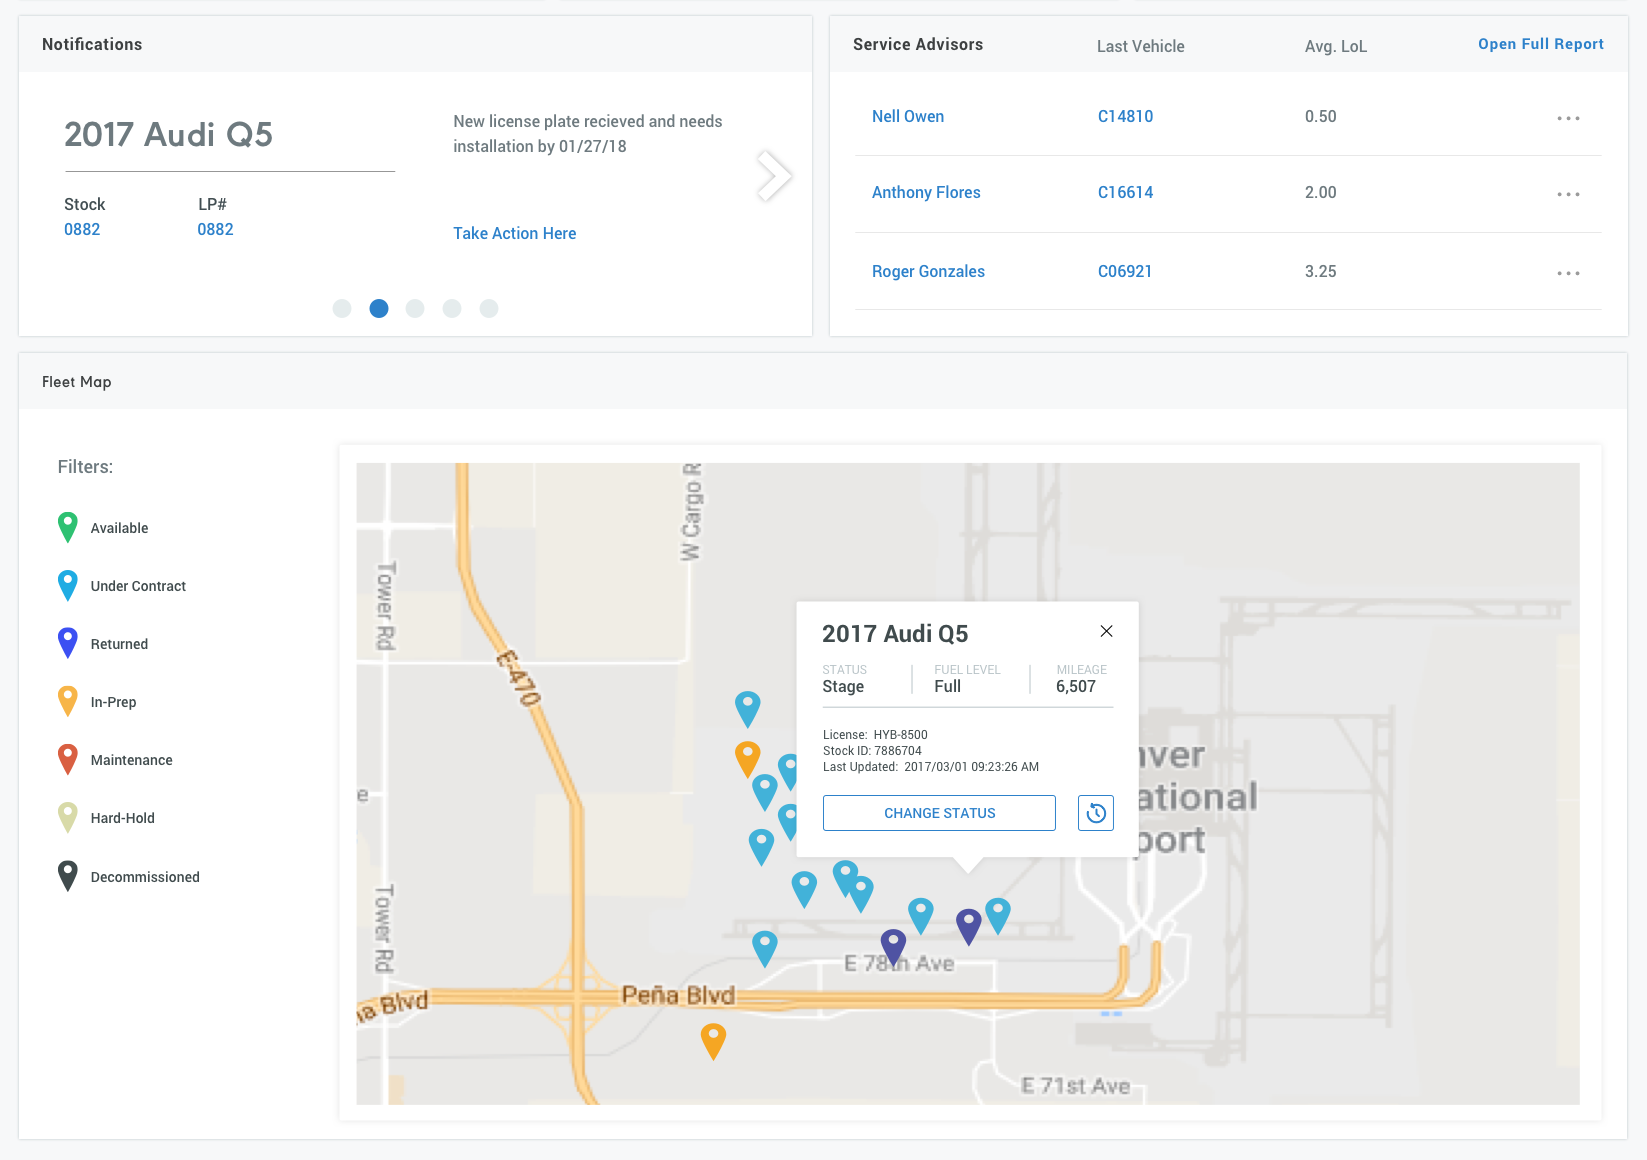
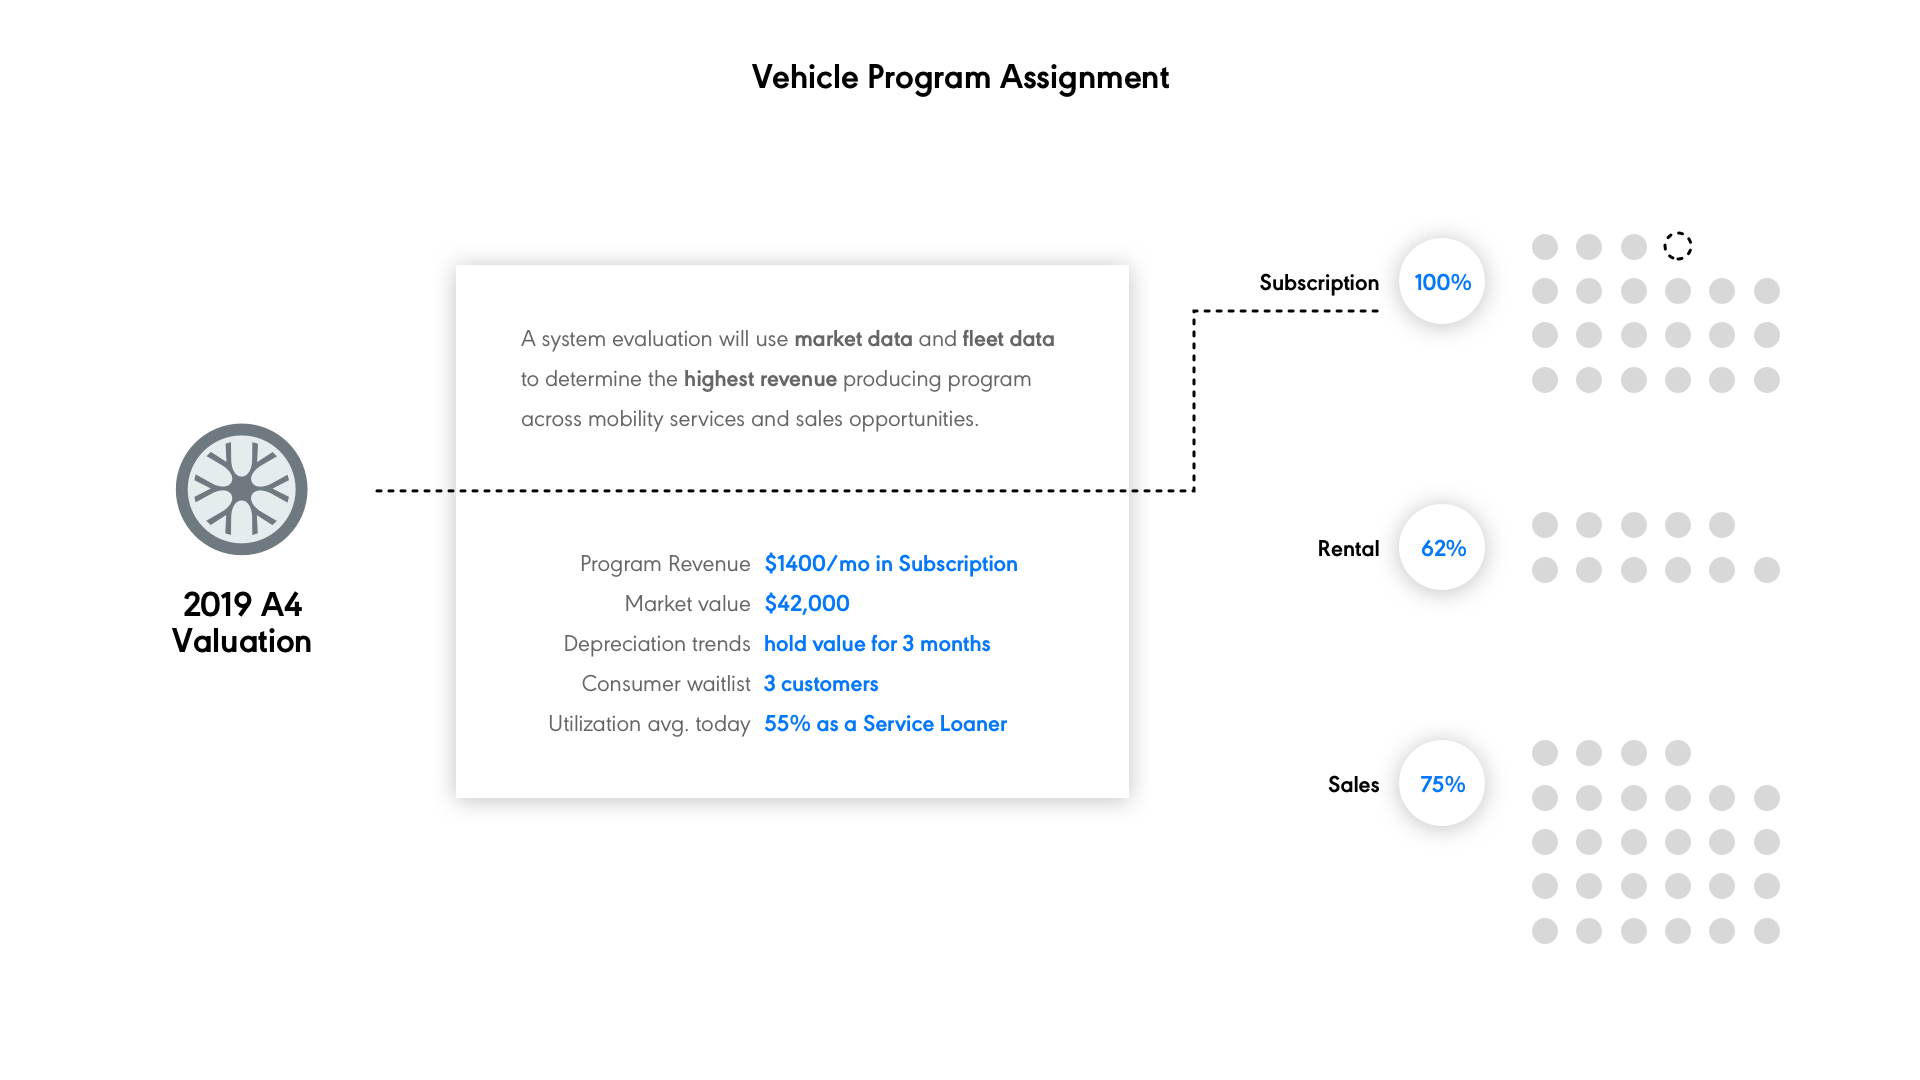
Use data intelligence to determine the most valuable service
Our systems had all the right data to help users determine when and where a vehicle should be to render the highest utilization. Below is a base model for developing this formula, and criteria that helps determine thresholds across these data points.
Result
- Locations today successfully operate these 3 services under one roof, reducing overhead for the company and increasing profits.
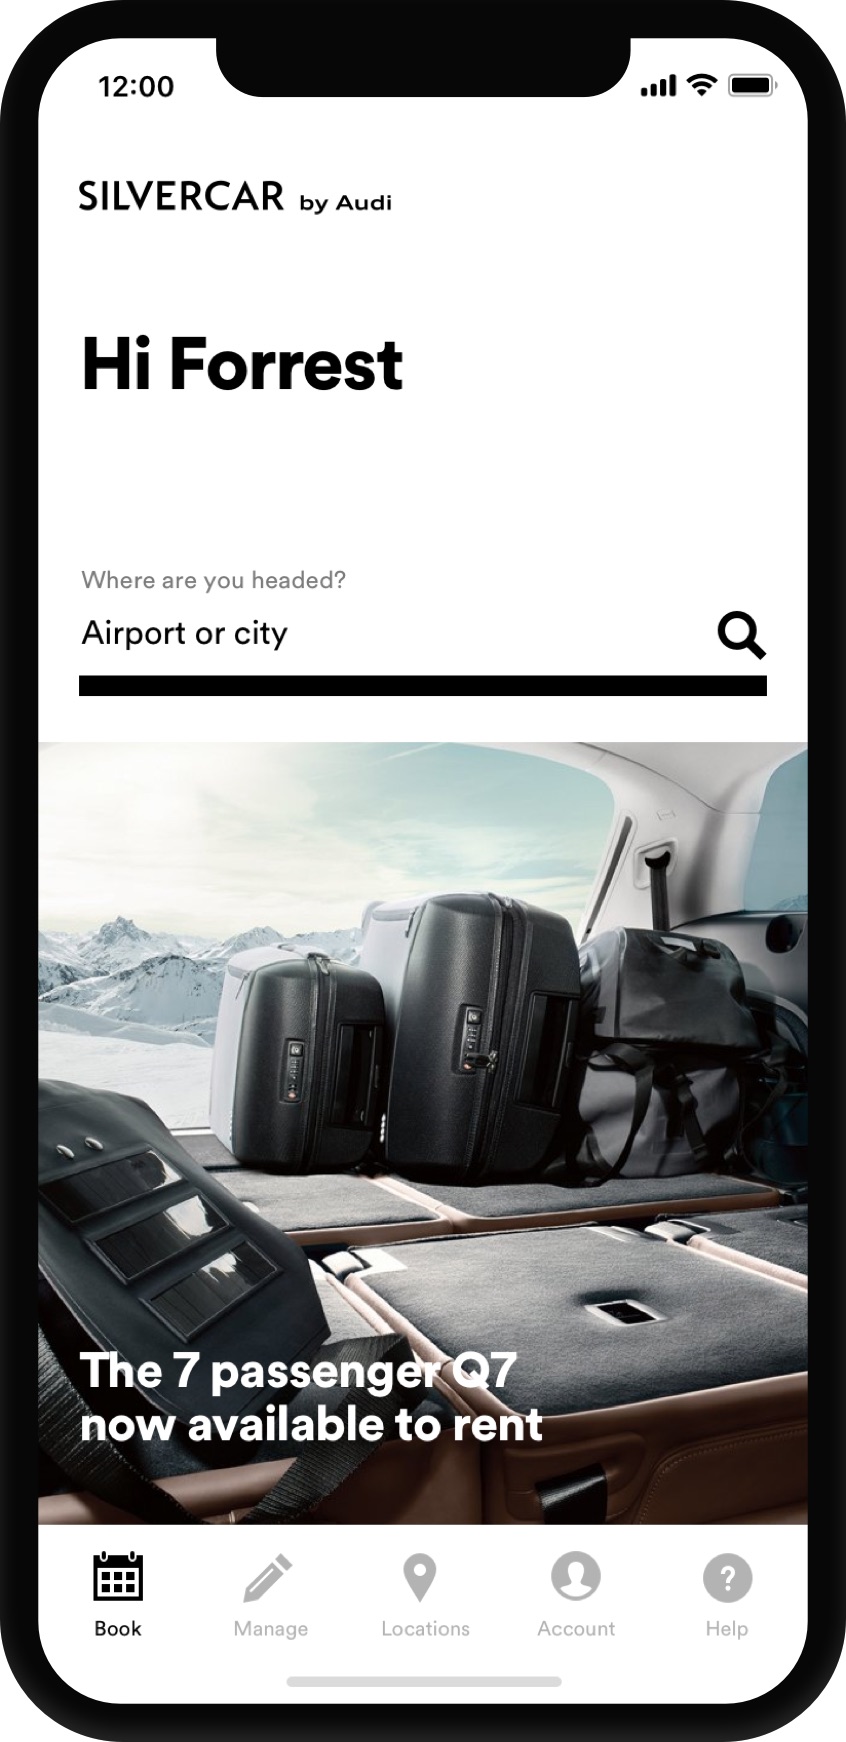
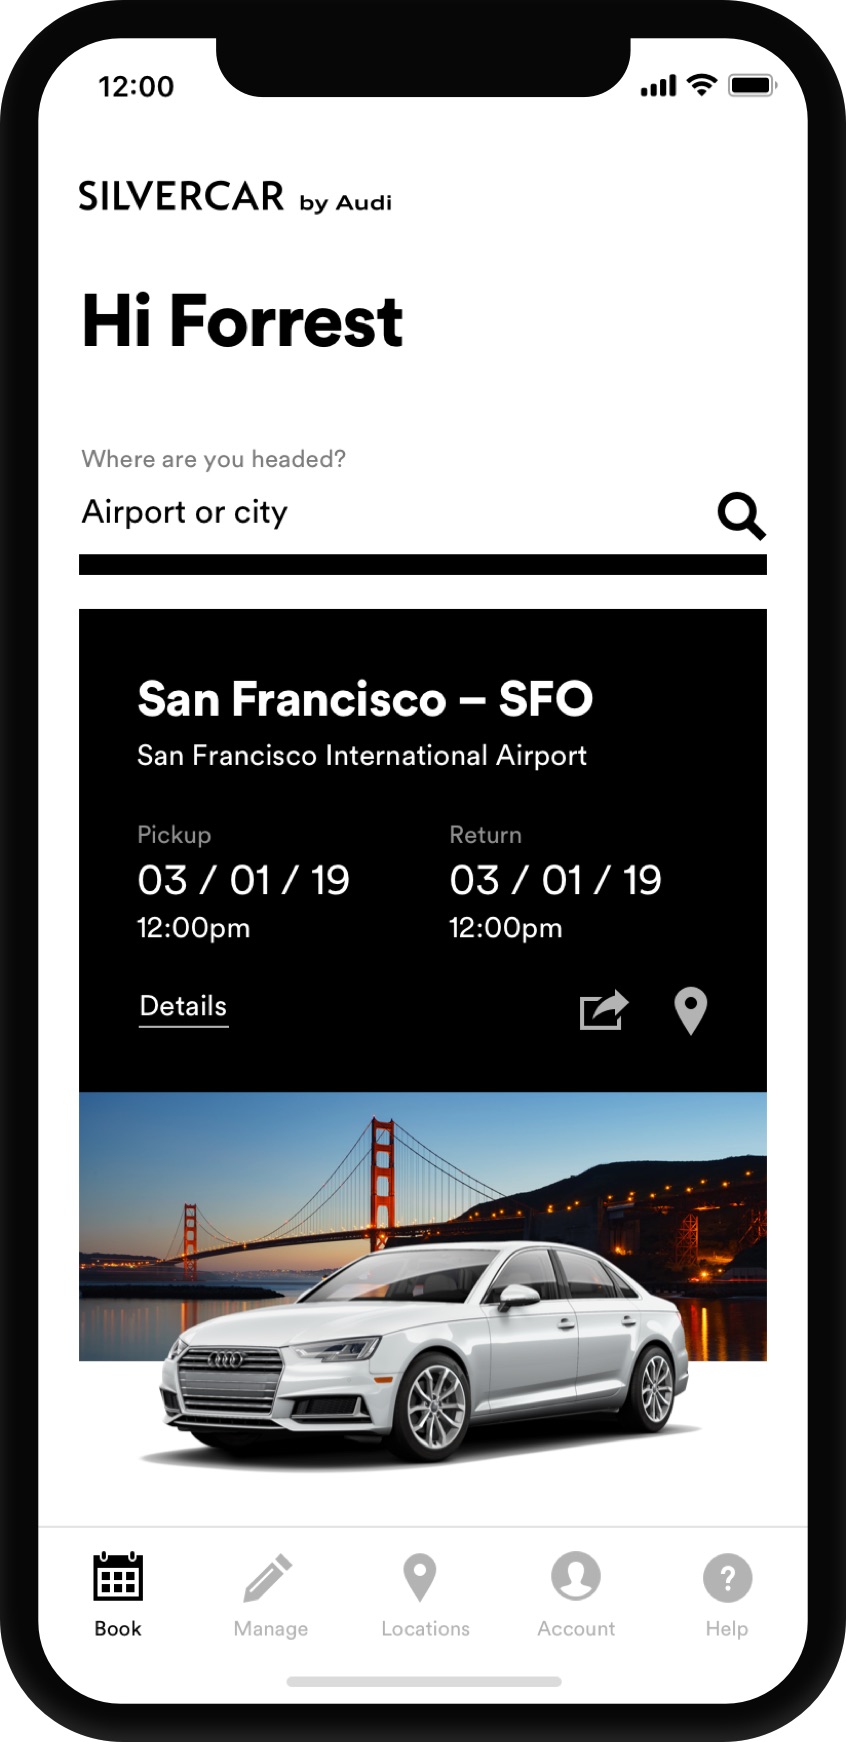
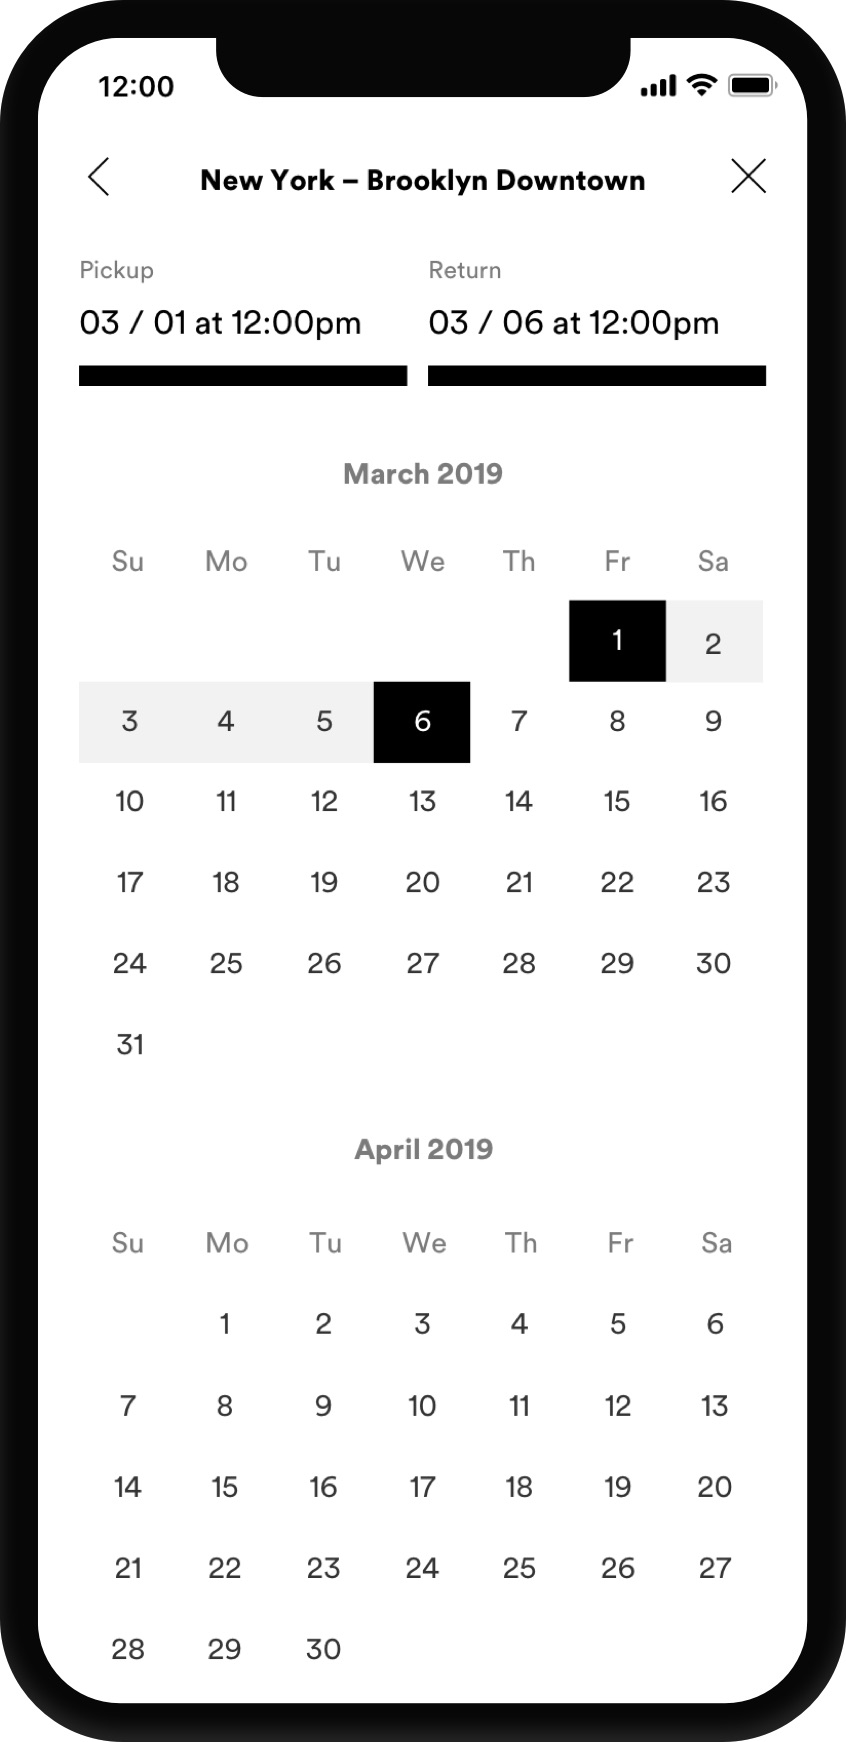
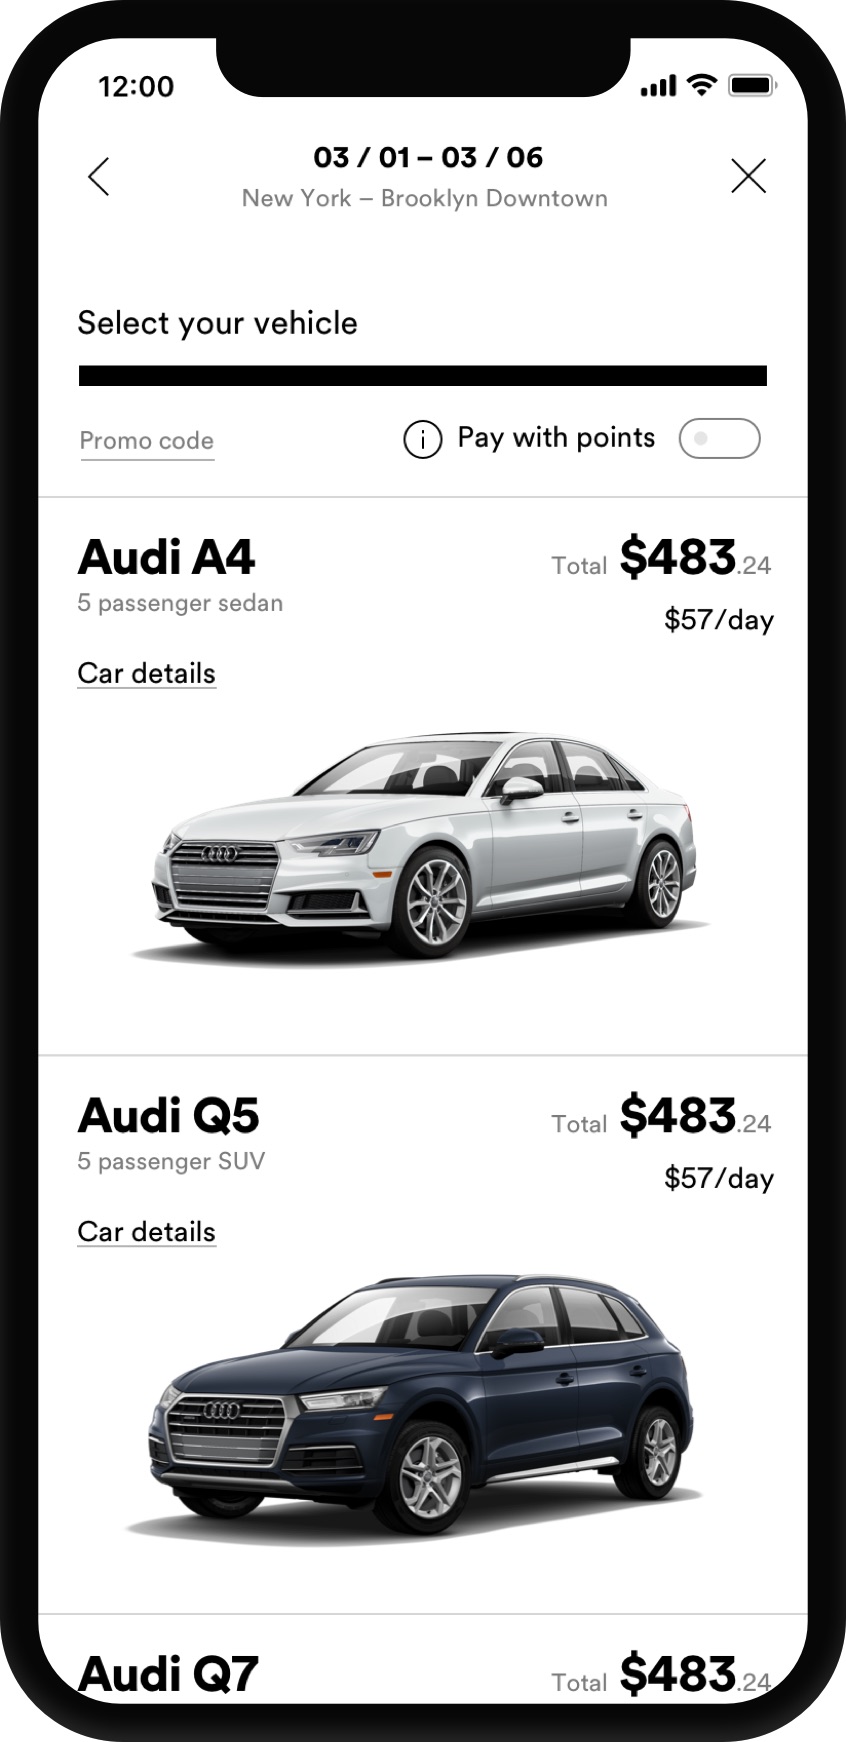
Dialing in the consumer app
Research planning and information architecture.

Prototyping
We focused on streamlining the booking flow while applying a new brand.
1.Display and compare what it costs to redeem points vs spending dollars.
2.Show additional vehicle details we had just release new vehicles.
3.Improve clarity on the insurance decision point.
Reducing Implementation Time
We were implementing 20 locations per month and business teams saw a need to scale that to 60 per month.
Situation
- The org was growing at a rate faster than that implementation team could keep up with, and business projections showed this compounding 3-4 fold through the year.
Tasks
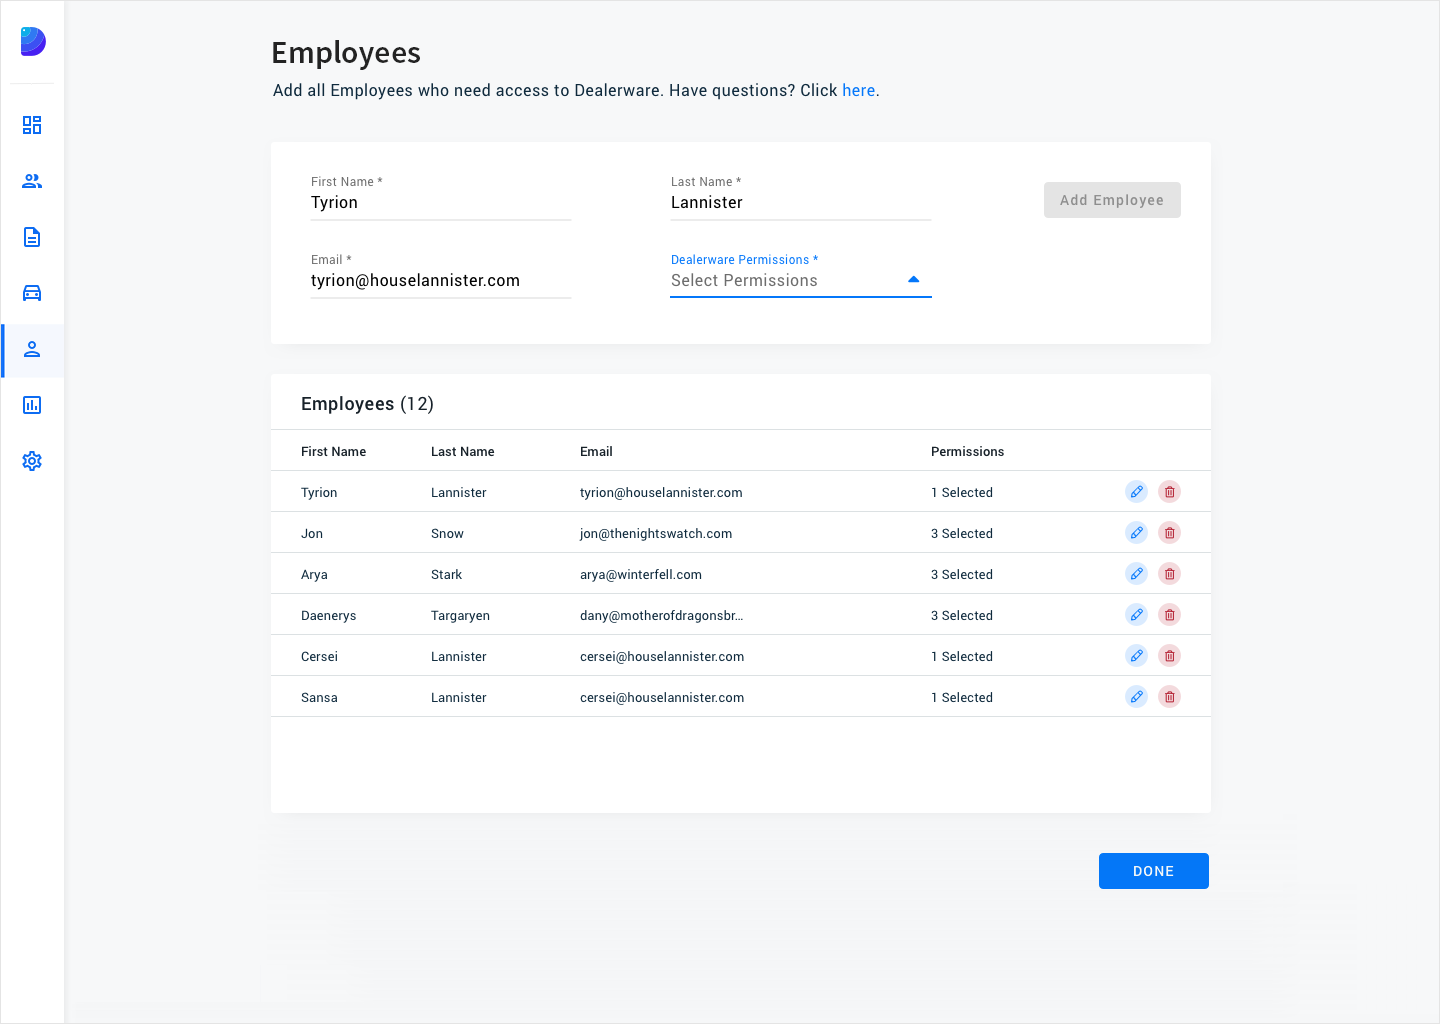
- Find a way to onboard new customers faster than the current 2 week experience, which had over 12 touchpoint between emails, phone calls, on-site visits, data revisions, etc.
Actions
- Conducted a design research study on the implementation process with internal teams
- Designed an onboarding experience put the ownership in the customers’ hands
Results
- We found that customers did not a key document our system was expecting which caused a delayed time-to-value
- We built an FTU experience that took our time-to-value metric from 2 weeks to 2 days, some as quick as 1-2 hours.
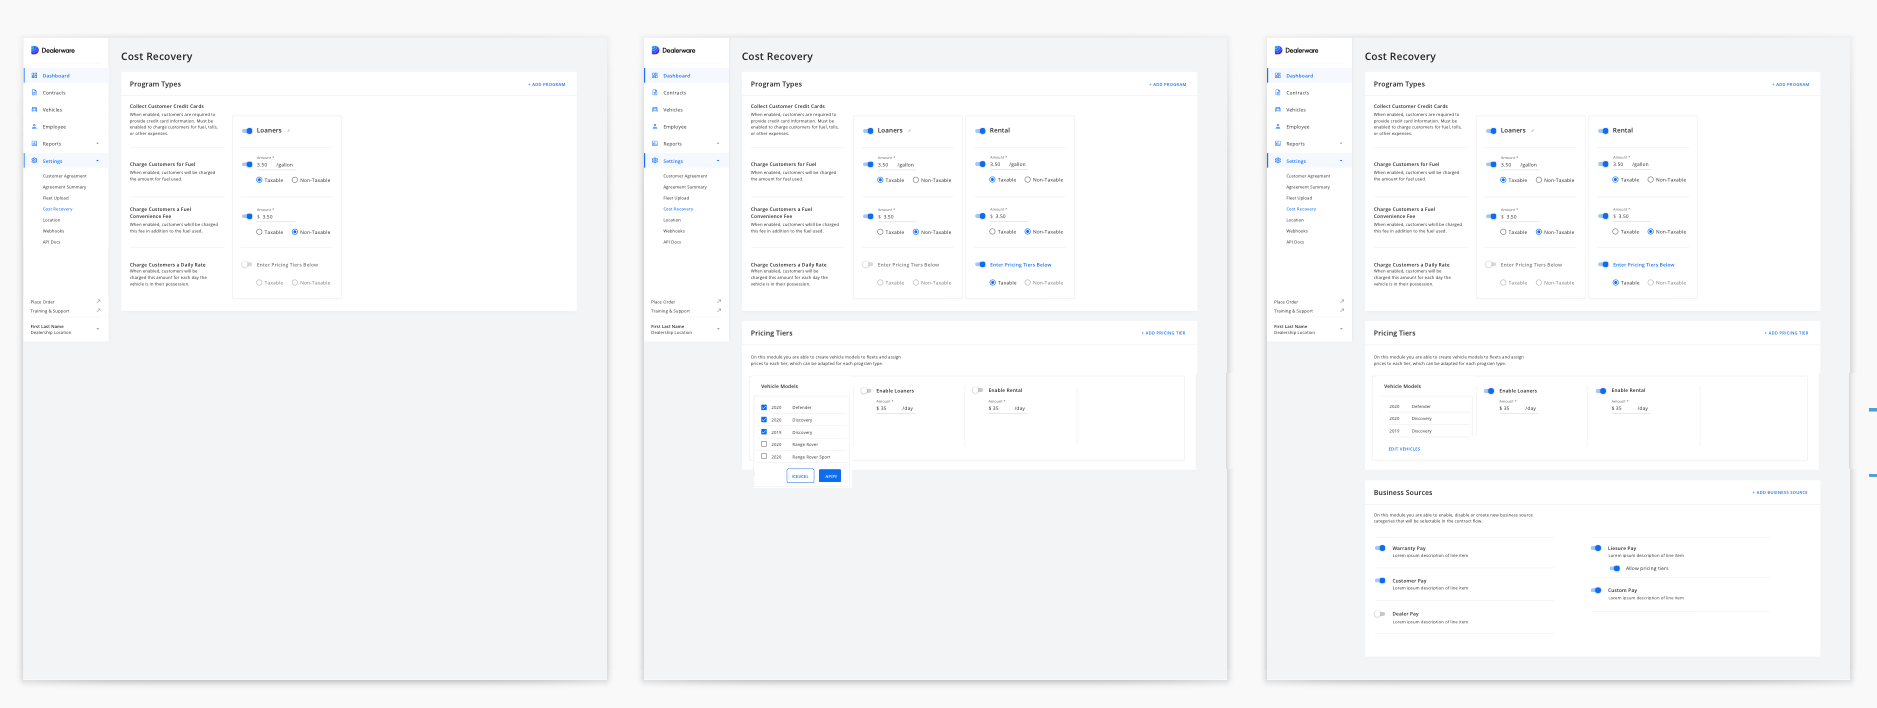
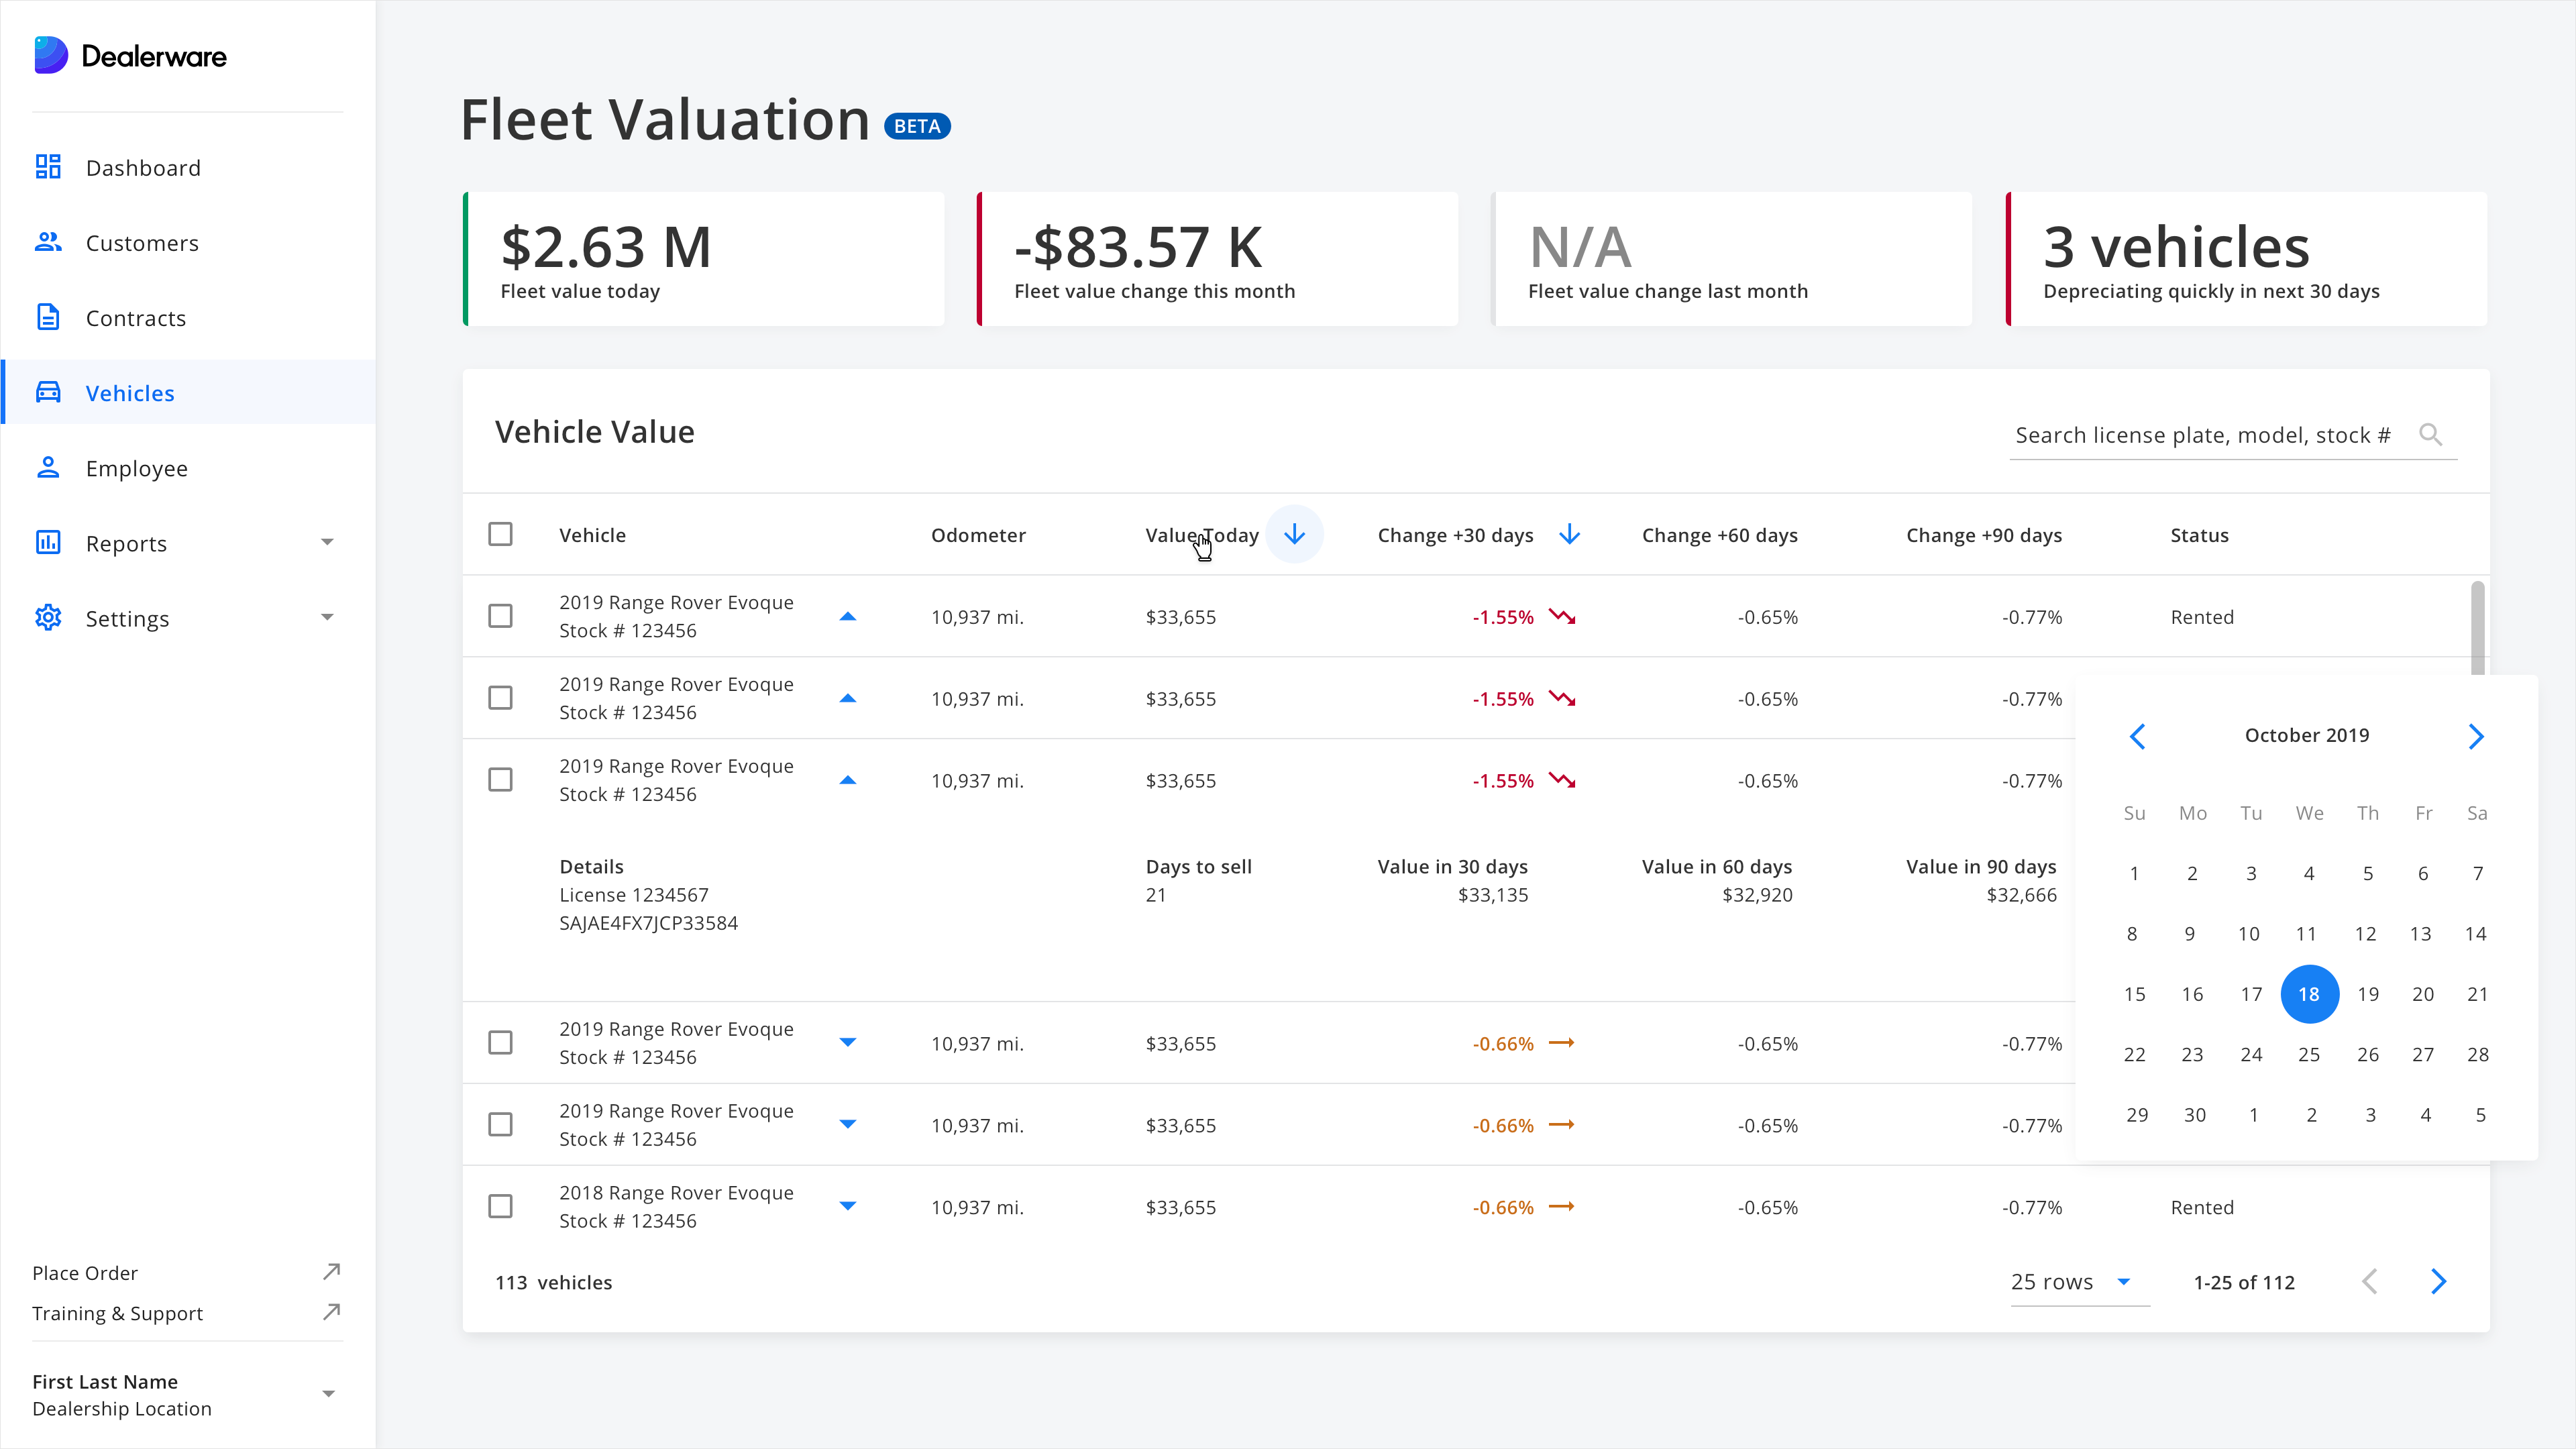
The Fleet Management Platform